Download
1 / 9
90 likes | 260 Views
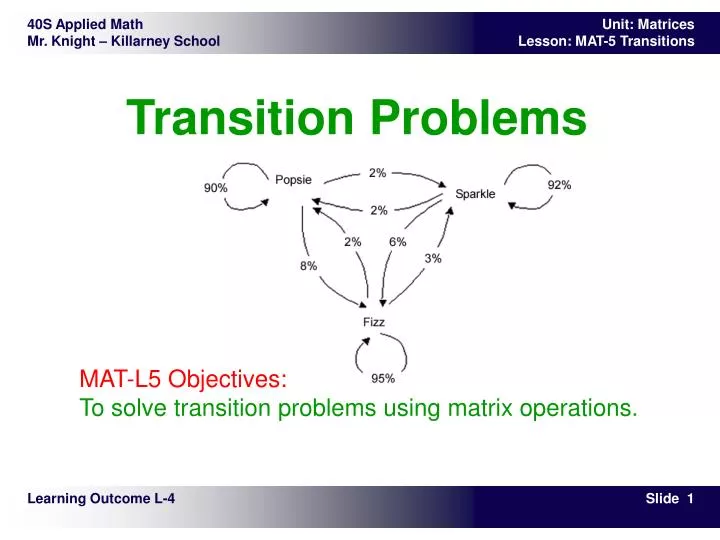
Transition Problems. MAT-L5 Objectives: To solve transition problems using matrix operations. Learning Outcome L-4.

E N D
Transition Problems MAT-L5 Objectives:To solve transition problems using matrix operations. Learning Outcome L-4
Changes occur around us all the time. Some of these changes may be random events, but some changes follow predictable patterns over an extended period of time. For example, the type and amount of recorded music bought by teenagers probably follows predictable patterns, and the music industry needs to adjust to the buying patterns of teenagers. After the patterns have been identified, matrix operations can be used to predict future events. Theory – Transitions & Predictions
Before we can predict future events, we must write an initial population matrix. This is a row matrix that identifies the initial population before changes occur.Consider the following example:A small community has a workforce of 1800 people, with 1680 employed and 120 unemployed. During the course of one year, 10% of the employed workers will lose their jobs and 60% of the unemployed will find jobs.We will label the initial population matrix A. Now:Therefore, the initial population matrix is: Theory – Initial Population Matrix
The previous example is repeated below:A small community has a workforce of 1800 people, with 1680 employed and 120 unemployed. During the course of one year, 10% of the employed workers will lose their jobs and 60% of the unemployed will find jobs.The changes in employment are illustrated in the following transition diagram. This shows that 0.90 or 90% of the employed remain employed, and 10% become unemployed. Likewise, 0.40 or 40% of the unemployed remain unemployed, and 60% become employed. Theory – Transition Diagram
A transition matrix is a square matrix that shows the probability of the population remaining in the same state or changing to another state. For example, there is a 100% chance that an employed person will either remain employed or become unemployed. Likewise, there is a 100% chance that an unemployed person will become employed or remain unemployed.The previous example is repeated again:A small community has a workforce of 1800 people, with 1680 employed and 120 unemployed. During the course of one year, 10% of the employed workers will lose their jobs and 60% of the unemployed will find jobs.Let B represent the transition matrix.ThenWe now write the elements in the transition matrix in decimal form.Note that each row must add to 1.0, which indicatesthat 100% of the population is accounted for. Theory – Transition Matrix
From the previous example, the initial population matrix isand the transition matrix is:To predict the number of people employed and unemployed after one year, you multiply the population matrix and the transition matrix.Let matrix C represent the number employed and unemployed after one year.Therefore, after one year, the number employed is 1584 and the number unemployed is 216. Theory – After One Year
To predict the number of people employed and unemployed after two years, you can multiply population matrix C with transition matrix B, or multiply population matrix A by the square of transition matrix B. Let matrix D represent the populations after two years.We now haveTherefore, after two years, the number employed is 1555 and the number unemployed is 245.Likewise, after five years the number employed and unemployed could be represented by matrix E, and calculated as:Therefore, after five years, the number employed is 1543 and the number unemployed is 257. (These numbers represent rounded values.) Theory – After Two (+) Years
The Paper Street Soap Company sells laundry detergent in two-litre and five-litre packages. Their research shows that 34% of the people buying the small package will switch to the large package for their next purchase, and 12% of the buyers of the large package will switch to the small package for their next purchase. The original market share was 55% for the small package and 45% for the large package. Test Yourself – Paper Street Soap
A small store in a remote community sells three brands of soft drinks. The three brands are Popsie, Sparkle, and Fizz. The current market share is 60% for Popsie, 31% for Sparkle, 9% for Fizz. Since the store is located in a remote community, the store manager needs to place orders 12 months in advance. (The winter roads to the community are operational for a few weeks of the year, and airfare for soft drinks is too expensive.) Test Yourself – Popsie