Download
1 / 31
310 likes | 429 Views
PAMRO 2008 Lagos. SAARF OUTDOOR. First Results from GPS Measurement Survey. South Africa. This Presentation Covers ●●●. Industry Requirements Outdoor Methodology Universe of Sites Processing of Data Results Next Steps in Progress. Industry Requirements.

E N D
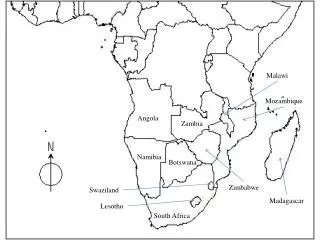
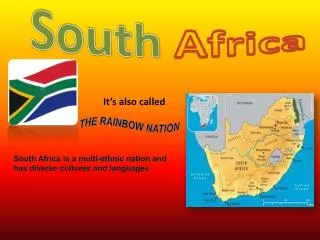
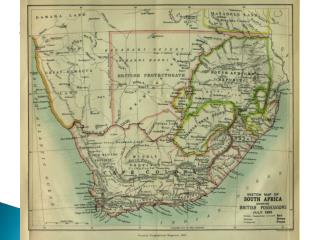
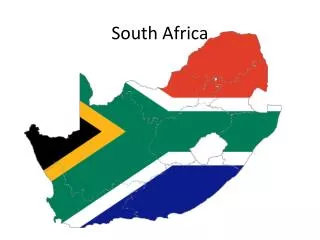
PAMRO 2008 Lagos SAARF OUTDOOR First Results from GPS Measurement Survey South Africa
This Presentation Covers ●●● • Industry Requirements • Outdoor Methodology • Universe of Sites • Processing of Data • Results • Next Steps in Progress
Industry Requirements • SAARF Outdoor Tender awarded to Nielsen 2006 - 2008 • Specifications included: • Electronic Measurement using a GPS device • Providing an Outdoor measurement that is • accurate • reliable • comparable with other media • Synergies with SAARF Readership and Radio Survey
Outdoor GPS Device • The Nielsen Personal Outdoor Device (Npod) was used • The Npod was developed in conjunction with RDP Associates, with thorough testing • To accurately Track respondent travel patterns • Npod strengths include: • More advanced chip set than commercial units for greater sensitivity • Size of a standard cellphone for ease of carrying • Sufficient memory to allow collection every few seconds over 9 days • Accurate measurement of location, time, speed and direction of travel
The Interview • The national readership and radio surveys provided the placement interview for Outdoor • At the end of the placement interview, respondents were asked to carry an Npod for 9 days • The Npod was then collected with the Radio Diary and self-completion questionnaires • Participants were asked to fill in a short daily travel log to be collected at the same time • Travel log data used as a post – processing comparative tool
Successful Field Placement • Was facilitated by: • Detailed Personal briefing of respondent by interviewer • Various Respondent Aids including : • Welcome Letter • Quick Instruction pamphlet • Frequently Asked Question document with interviewer's telephone number • Colour, laminated Magnetic Reminder card to be placed anywhere in the home • Respondents were also given a gift for participation (thermal travel mug) • On successful collection, the respondent was entered into a cash draw • Success rate was continuously monitored, with subsequent debriefing and rebriefing of interviewers
The Elepod • When travelling in a vehicle, the Npod needed to be placed on the dashboard or at the back window to ensure satellite reception • South Africa has a high incidence of theft from vehicles • In order to reassure respondents, Nielsen developed the Elepod to hide the Npod “in plain sight” • Very successful – no reported incidents of Npod loss through “smash and grab” • And the respondent got to keep his Elepod!
Sampling • A sub-sample of SAARF AMPS (All Media and Products Survey) respondents were selected • Area – stratified probability sampling was used • Outdoor sub-sample was drawn by selecting every “nth” AMPS point (one male, one female) after a random start • The latest AMPS survey was analysed to obtain incidence of mains electricity by sub area, and the Outdoor contact sample was boosted appropriately • A cost-effective decision was made to cover selected provinces each year and build to a national picture over 3 years
Sampling (Cont.) Province Sample Design Year 1 358 872 Gauteng KwaZulu-Natal 2006 2 230 666 600 Eastern Cape Western Cape 2007 1 266 4 320 360 200 264 Free State Northern Cape Mpumalanga 2008 824
The Universe • Adults (16 years or older), living in private households, with mains electricity, were selected from the host AMPS sample • For the 2006 survey, in Gauteng and KwaZulu-Natal, the Outdoor universe equated to 83% of the AMPS universe across these two provinces • Response rates were exceptionally high: 87% of Npods were recovered + useable from Gauteng + KwaZulu-Natal (2006)
The In-Tab Sample • On collection of Npods, the data was downloaded and sent to the U.S. for post-processing • “In-Tab” respondents were identified (i.e. respondents with at least 2 good days of usable Npod data, who were compliant with the survey rules of carrying the Npod, whenever travelling outside the home) • The final In-Tab sample size in 2006 was 82,5% of the realised sample • 87.8% of In-Tab respondents travelled across 9 days • 12.2% of In-Tab respondents had no travel across 9 days • Compares to AMPS (15%) • 77.5% of In-Tab respondents passed at least one Outdoor Site during the 9 days • Compares to AMPS (81.7%) • The average weighted In-Tab days per respondent was 7.4 (out of 9 Days)
Selection of Sites • The survey covered all static Out of Home media that are located “out of doors” and that belong to participating media owners • These media owners supplied all their site information in an electronic database • Training on geo-coding of sites was offered to media owners by Nielsen • Site databases were checked by Nielsen for completion and range validity • In addition, a 10% site check was undertaken by Nielsen across media owner, area and site type • Total number of sites in 2006 survey = 5 955 • 3 824 in Gauteng • 2 131 in KwaZulu-Natal
Travel vs Passage Data • Travel Data • GPS data from In-Tab respondents was converted to travel data via a sophisticated proprietary software system, which addressed “urban canyons” as well as small roads running parallel to large thoroughfares • Passage Data • Respondent travel data from Npod was converted into passage data by integrating travel data with the database of Out of Home Sites
Radius SiteExposureAngle140º Site Visibility Zone Opportunity to See • “Opportunity to See” (OTS) a site is defined as “Respondent is in the geographic area of the Site location, has a potential line of site, and is travelling in a direction favourable to the site” • Creation of the concept of a Visibility Zone • A respondent was credited with opportunity to see the site if he/she: • travelled through the visibility zone • in a direction favourable to the site face • on or near the primary road associated with the site Example
Post Processing Verification • Following the initial processing of Site data and production of Passage data, potential anomalies were investigated: • Sites with zero passage • Sites with invalid primary road designation • Street segments with high range of passage • Nearby sites with varying passage • Where problems were revealed, these were corrected either by Media owners or by Nielsen • The updated master site database was then reprocessed and final anomalies checked and corrected
Data Smoothing • Due to sample limitations and certain areas with no sample, 21% of boards had zero exposure, and some had extreme levels • This restricted analysis capabilities (e.g. geographical subdivisions) and increased campaign variability • Sites with zero passage also needed to be imputed • Data were smoothed so that: • Average exposures by area by site type were unchanged • Extremes were reduced and zeroes eliminated • Results were more logical and usable, but unchanged overall • The Smoothing reduced campaign variability by 50%
Release Datafile • In South Africa, Third Party Processors provide the Industry with Media Scheduling Analysis Software • A number of these have purchased the Outdoor Release Datafiles from SAARF • This Release Datafile included the modelled passage for sites with no sample data • Initial feedback from media owners has been very positive
Npod vs AMPS • Demographic profiles of exposure were comparable with AMPS • Urban dwellers • 35 - 49 year olds • Working, Educated, Higher income respondents • Please note that all the data in the slides that follow are smoothed
Top-Line Results Compare well with AMPS “Billboard” Weekly Reach % • AMPS : Recalled data • Npod : Measured actual weekly exposure
Average Daily Exposures • Overall average daily exposures = 9.8 per day • Urban = 10.6 per day / Greater Johannesburg = 20 exposures per day • Rural = 5.8 per day • Differences by demographic are similar to reach, but usually a bit more extreme
Next Steps in Progress
Outdoor – Year 3 - 2008 • The last stage of the survey is currently in field • In the provinces of:Free State Northern Cape and Mpumalanga • When this is complete, we will be able to build to a national picture for South Africa! 824