Download
1 / 40
400 likes | 603 Views
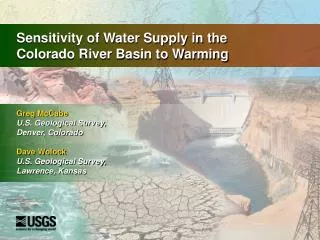
Optimized Flood Control in the Columbia River Basin for a Global Warming Scenario. Se-Yeun Lee 1 , Alan F. Hamlet 2,1 Carolyn J. Fitzgerald 3 Stephen J. Burges 1 Dennis P. Lettenmaier 1, 2. Dept. of Civil and Env. Engineering, UW CSES Climate Impacts Group, UW

E N D
Optimized Flood Control in the Columbia River Basin for a Global Warming Scenario Se-Yeun Lee1, Alan F. Hamlet 2,1 Carolyn J. Fitzgerald3 Stephen J. Burges1 Dennis P. Lettenmaier1, 2 Dept. of Civil and Env. Engineering, UW CSES Climate Impacts Group, UW U.S. Army Corps of Engineers, Seattle District
Red - Negative Trend Blue – Positive Trend Trends in April 1 Snowpack from 1950-1997 Mote P.W.,Hamlet A.F., Clark M.P., Lettenmaier D.P., 2005, Declining mountain snowpack in western North America, BAMS, 86 (1): 39-49
As the West warms, spring flows rise and summer flows drop Stewart IT, Cayan DR, Dettinger MD, 2005: Changes toward earlier streamflow timing across western North America, J. Climate, 18 (8): 1136-1155 Red - Negative Trend Blue – Positive Trend
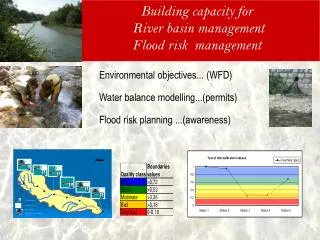
Hydrologic Impacts of Global Warming on Snowmelt Dominant Rivers • Increased Winter Flows • Reduced Spring Snowpack • Earlier Melt • Earlier Spring Peak Flow • Decreased Summer Flow
Flood Control vs. Refill : Current Climate Full
Flood Control vs. Refill : Current Climate : + 2.25 oC No adaption Streamflow timing shifts can reduce the reliability of reservoir refill + 2.25 oC Full
Flood Control vs. Refill : Current Climate : + 2.25 oC No adaption : + 2.25 oC plus adaption Streamflow timing shifts can reduce the reliability of reservoir refill + 2.25 oC Full
Refill Flood Control Objective: • Develop Systems Engineering Procedures for Rebalancing Flood Control and Reservoir Refill
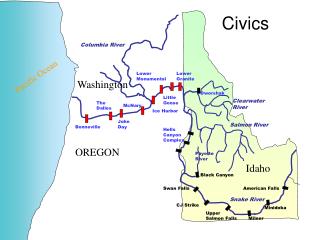
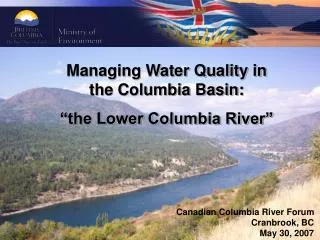
Test Case: The Columbia River Basin Multi-objective Reservoir System • Flood Control • Hydropower • Instream Flow • Water Supply • Recreation • Navigation
Bonners Ferry Columbia Falls The Dalles Major U.S. Flood Control Checkpoints
Optimization –Simulation Models Methods • Developing Optimized Flood Control Curves • Testing and refining Proposed Rule Curves
HEC-PRM (Hydrologic Engineering Center’s Prescriptive Model) • Optimization model developed by the US Army Corps of Engineers • Penalty functions are used to constrain the Columbia River basin system operation • Flood control penalties • Storage penalties
ColSim (Columbia Simulation Model) • Flood control • Hydropower • Irrigation • Instream flow • Navigation • Recreation
Adjust Parameters Calibration Strategy
Columbia Falls Bonners Ferry The Dalles Calibration Results (Flood Control) Red - Current FC Blue - Optimized FC
VIC Hydrologic Model (Variable Infiltration Capacity Hydrologic Model) • Macroscale Hydrologic Model developed by University of Washington
Climate Change Scenario • Remove historic monthly temperature trends from the daily time step forcing data • Increase the temperatures by 2 oC (annual average) in a seasonal pattern derived from several GCM simulations • Observed precipitation
: Current Climate : Climate Change Scenario Monthly Simulated Reservoir Inflows
Current Flood Rule Curves • Flood Control Rule Curves are selected by Apr-Jul Flow Volume
New Flood Rule Curves • Find Flow Volume Ranges for each category with an equal number of events
FC 4 New Flood Rule Curves • Find Flow Volume Ranges for each category with an equal number of events • Use 80thpercentile values for each categories as a Flood Rule Curve : 17 ensemble traces : 80th percentile of ensembles
Optimization Model ResultsCurrent Climate vs Climate Change Scenario
Feb Mar Dworshak storage(Dworshak Apr-Jul flow volume >2.40 MAF) a) 20th Century Climate b) Climate Change Scenario : Ensemble traces : 80th percentile of ensembles
Mar Apr Libby storage (Libby Apr-Aug flow volume >5.5 MAF) a) 20th Century Climate b) Climate Change Scenario : Ensemble traces : 80th percentile of ensembles • The changes in flood control rule curves are different for different projects
Full Refill Probability of Libby (Libby Apr-Aug flow volume>5.5 MAF)
Refill Probability of Dworshak (Dworshak Apr-Jul flow volume >2.40 MAF)
: The Dalles Apr-Aug < 68 MAF : 68 <= The Dalles Apr-Aug <100 MAF : The Dalles Apr-Aug >=100 MAF • Greatest Improvement occurs in Mid flow years ( ) Changes in Reservoir Storage
Conclusions • Optimization studies provide an objective method for rebalancing flood control and refill objectives in complex reservoir systems in response to hydrologic changes. • The changes in flood control rule curves are different for different projects, corresponding to different changes in flow volume and timing associated with warming in each sub basin.
Conclusions • Optimized flood control rule curves show reduced flood evacuation and earlier refill timing; up to one month earlier for a climate change scenario, compared with 20th century climate. • For the climate change scenario, optimized flood rule curves increase reservoir refill as well as the system storage in moderate and high flow years, while providing comparable levels of local and system-wide flood protection in comparison to the current flood control rule curves.
Future Work • Extension and refinement of our methods using daily time step optimization and simulation models is needed to evaluate the robustness of these techniques in more detailed planning studies.