Download
1 / 39
390 likes | 550 Views
EVSC 495/EVAT 795 Data Analysis & Climate Change. Instructor: Michael E. Mann. Class hours: TuTh 2:00-3:15 pm. EVSC 495/EVAT 795 WEBPAGE http://holocene.evsc.virginia.edu/~mann/COURSES/495homeFall04.html SYLLABUS LECTURES COURSE INFORMATION PROBLEM SETS.

E N D
EVSC 495/EVAT 795Data Analysis & Climate Change Instructor:Michael E. Mann Class hours: TuTh 2:00-3:15 pm
EVSC 495/EVAT 795 WEBPAGE • http://holocene.evsc.virginia.edu/~mann/COURSES/495homeFall04.html • SYLLABUS • LECTURES • COURSE INFORMATION • PROBLEM SETS
Although there is no ideal textbook for the class, the following book is helpful as supplementary material (two copies are available on reserve in the Science & Engineering library): Statistical Methods in the Atmospheric Sciences, D. Wilks, 1995 (Academic Press)
LECTURE 1 INTRODUCTION Hypothesis testing; Probability; Distributions Supplementary Readings: Wilks, chapters 1-4
Applications of statistics to the study of climate variability and climate change • Comparing theoretical predictions and observations • Detecting statistically significant trends • Characterizing spatial and temporal patterns of variation
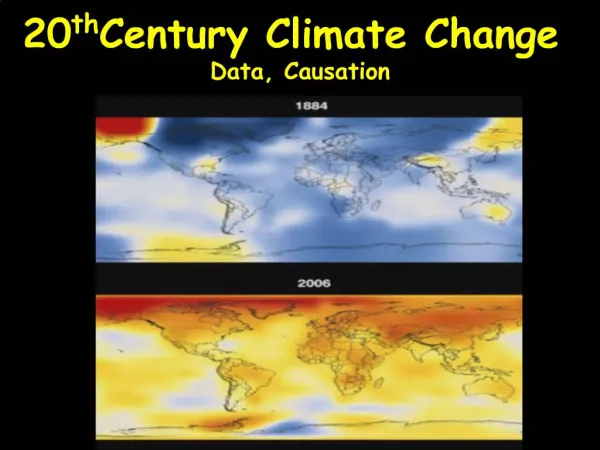
Global Temperature Trends Applications of statistics to the study of climate variability and climate change The instrumental surface temperature record is not perfect. Combined global land air and sea surface temperatures 1860-1997 (relative to 1961-1990 average)
Applications of statistics to the study of climate variability and climate change The instrumental surface temperature record is not perfect. Note how much sparser the data is prior to prior to the 20th century... Grayshade: 1902-1993 Checkerboard: 1854-1993
The instrumental surface temperature record is not perfect. Note how much sparser the data is prior to the early 19th century... Applications of statistics to the study of climate variability and climate change Global Temperature Trends
Applications of statistics to the study of climate variability and climate change Global Temperature Trends Statistical methods can be used to estimate the associated uncertainty
Multivariate ENSO Index (“MEI”) Applications of statistics to the study of climate variability and climate change Recent history of ENSO phenomenon
Applications of statistics to the study of climate variability and climate change For the hemisphere on the whole, the warming or cooling due to the NAO is probably a zero-sum game (note that cooling is expected cooling over Greenland and most of Arctic sea, where no data is available “Explains” enhanced warming in certain regions of Northern Hemisphere in past couple decades
Hypothesis Testing • Test Statistic • Null Hypothesis (H0) • Alternative Hypothesis (HA)
Hypothesis Testing Statistical Model [Observed Data] = [Signal] + [Noise] “noise” has to satisfy certain properties! If not, we must iterate on this process...
Bayesian/Subjectivist vs Frequentist Approach Frequency Approach (ie, fraction occurances/opportunities of an event converges to the probability of the event)
Bayesian/Subjectivist vs Frequentist Approach Bayesian Approach Conditional Probability (Probability of E1 given the occurrence of E2) Consider Mutually Exclusive and Collectively Exhaustive (MECE) set of events {Ei} and an event A
Bayesian/Subjectivist vs Frequentist Approach Bayesian Approach Bayes’ Theorem
Prior Likelihoods Posterior Distribution Bayesian Approach Bayes’ Theorem
Prior Likelihoods Posterior Distribution Bayesian Approach The central equation of Bayesian statistics combines the prior distribution and the likelihood function to reach the posterior distribution: Bayes’ Theorem
Coin Flipping Example (Probability Of Heads) Binomial Distribution Consider probability of obtaining seven heads in ten flips: N=10; n=7 P(7)=0.12 What is “p”?
Coin Flipping Example (Probability Of Heads) Binomial Distribution Consider probability of obtaining seven heads in ten flips: What if the coin is weighted? How does the frequentist deal with this issue?
Coin Flipping Example (Probability Of Heads) Binomial Distribution Weighted coin
Coin Flipping Example (Probability Of Heads) Beta Distribution Weighted coin
Coin Flipping Example (Probability Of Heads) Probability density function Bayesian analysis of a set of coin flips. The prior density was calculated assuming 20 heads from 40 tosses for a perfect coin (p = 0.5). The likelihood or data density was calculated assuming 7 heads from 10 tosses. The resulting posterior density is also plotted qp
Coin Flipping Example (Probability Of Heads) The posterior distribution for Pr(heads) peaks just above 0.5 because of the observed data of 7 heads from 10 tosses. The extent of the shift from the data value (0.7) is incorporated into the analysis by the form of the prior distribution. In any case, as the number of observations, n, increases, the resulting distribution, becomes more concentrated at the observed ratio of heads to tosses. qp
Probability Distributions and PDFs • Binomial distribution • Poisson distribution • Gaussian distribution • Chi-squared distribution • Lognormal distribution • Gamma Distribution • Beta Distribution
Binomial Distribution Describes the probability distribution of multiple independent events characterized by a fixed rate of occurrence • Coin Flipping • Dice Rolling • Precipitation Occurrence?
(occurrence rate) Binomial Distribution Now consider the limit where p<<1 and N>>1 Under these circumstances, we have the approximation:
“Poisson” Distribution Histogram Estimate of PDF (mean occurrence rate)
Revisit the Binomial Distribution… Let s=n-N/2
Revisit the Binomial Distribution… Now consider the limit where N>>1 (but p finite) We now can make use of Stirling’s approximation:
Z Gaussian or “Normal” Distribution
NINO3 (90-150W, 5S-5N) 1998 GLOBAL TEMPERATURE PATTERN Heavily influenced by a huge El Nino
Mean Standard Deviation Variance NINO3 (90-150W, 5S-5N)
Histogram of Monthly Nino3 Index Goodness of fit? Topic of next lecture…