Download
1 / 39
390 likes | 489 Views
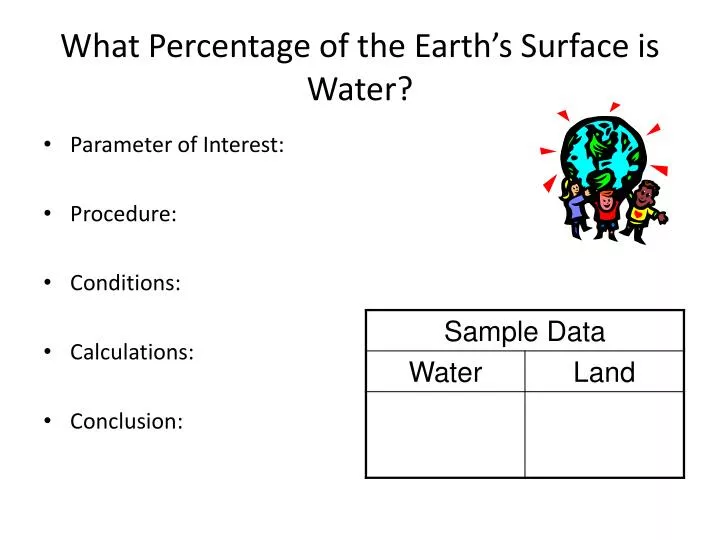
What Percentage of the Earth’s Surface is Water ?. Parameter of Interest: Procedure: Conditions: Calculations: Conclusion: . Measure The Correlation. For each of the following scatterplots : Draw a symmetrical ellipse that characterizes the data.

E N D
What Percentage of the Earth’s Surface is Water? • Parameter of Interest: • Procedure: • Conditions: • Calculations: • Conclusion:
Measure The Correlation For each of the following scatterplots: • Draw a symmetrical ellipse that characterizes the data. • Draw the major and minor axes of the ellipse • Calculate
Randomness and Scrabble Using the TI-84 to randomly pick a word from a dictionary: {randint(1, # of pages), randint(1, # of columns), randint(1, # of words in column)}
Law of Large Numbers • Flip an “object” 25 times. • Record the results in the following table. (Tip Up – 1, Tip Down – 0)
Simulating The Central Limit Theorem on the TI-84 • Store 0 in rand 0 rand [This seeds the random number generator and allows everyone to have the same population.] • Create a population. • Uniform Discrete randInt (first value, last value, number of values) L1 • Uniform Continuous First value + Width x rand(number of values) L1 • Normal randNorm(mean, standard deviation, number of values) L1 • Binomial randBin(number of trials, prob. of a success, number of values) L1
Run PGRM CLT • Population is in L1 • Number of Samples is ___________. • Sample Size is ___________. • Your population is stored in LPOP, samples are temporarily stored in LTEMP, and sample means are stored in LXBAR.
What relationship seems to exist? • What type of transformation will make this relationship linear?
Female Mathematicians A company has 11 mathematicians on its staff, of who three are women. The president of the company is concerned about the small number of women mathematicians. The president learns that about 40 percent of the mathematicians in the United States are women, and asks you to investigate whether or not the number of women mathematicians in the company is consistent with the national pool.
Female Mathematicians • 40 percent of the mathematicians in the United States are women • H0: p = .40 A population parameter • 11 mathematicians on its staff (3 women) • A sample statistic • The president of the company is concerned!!
Female Mathematicians • Let’s simulate! • Using your bag of dice, simulate an 11-mathematician company, assuming 40% of the mathematicians are female. • Our statistic of interest will be the number of females. • Simulate 10 trials and graph your statistics on the dotplot on the board. • Determine the p-value.
M&Ms Statistics Are M&M’s Color Distributions Homogenous? • Variable of Interest: • Colors • Parameter of Interest: • Population Distribution of Colors • Test: • Χ2 Test of Homogeneity • Null Hypothesis: • H0: Color Distributions of the different types of M&Ms are the same • Alternative Hypothesis: • Ha: Color Distributions of the different types of M&Ms are not the same • Conditions: • Random Sample – we will assume the company has mixed the colors • Count Data – we are counting the number of M&Ms by color • Expected Counts > 5 - see table • Test Statistic: • Decision Rule: • If P-Value < .05, Reject H0
Sample Data • Decision:
Statistical Inference with Barnum’s Animal Crackers • Questions: • How many types of animals are there? • How many animals are in a box? • Null Hypothesis: • Alternative Hypothesis: • Test Statistic: • Conditions: • Sample Data:
The Runners Population • Peachtree Road Race 2008 Runners • Top 2590 Runners • Rank, Gender Rank, Name, Age, Gender, Home State (or country if not USA), Time
Benford’s Law • Benford's Law (which was first mentioned in 1881 by the astronomer Simon Newcomb) states that if we randomly select a number from a table of physical constants or statistical data, the probability of the occurrence of a digit d =
Quote of the Day • Robert Mathews, commenting on medical studies which have a low p-value and thus are statistically significant but subsequently turn out to be duds when expanded to the general population. “The plain fact is that 70 years ago Ronald Fisher gave scientists a mathematical machine for turning baloney into breakthroughs, and flukes into funding. It is time to pull the plug.”
Movie Ticket Sales • Movie box office data sets provide excellent examples of forecasting features such as trend, seasonality, cycles, and randomness. The dataset contains both weekend and daily per theater box office receipts and total US gross receipts for the 49 movies shown. To increase student interest, movies were chosen from lists of recent Academy Award Best Picture winners, highest grossing movies, series movies (e.g. the Harry Potter series, the Spiderman series), and from the Sundance Film Festival.
Normal Probability Plots • Sort the data in ascending order • Assign a percentile to each data value • Convert the percentile to a z-score • Plot the z-scores vs. the data
Presidential Days How long have our presidents been in office?
Cash 3 Select three one-digit numbers (or one 3-digit number). Purchase your ticket for $1. If your number matches the chosen number, you win $500.
How do “weird” sample statistics behave?(The sampling distributions of standard deviation and correlation)
Matching Dogs to Owners Write down the numbers 1-6 For each numbered person in the following photos, write down the letter for the dog that is owned by that person.
A) 1. _____ B) 2. _____ C) 3. _____ D) 4. _____ E) 5. _____ F) 6. _____
A 1. _____ C 2. _____ F 3. _____ E 4. _____ B 5. _____ D 6. _____