Download
1 / 61
660 likes | 938 Views
Using STAAR data to guide learning. August 20, 2014 District Professional Learning Session #174. Intended outcomes. Understand the use of thresholds to set student goals and monitor growth Identify critical TEKS to serve as the focus for learning improvement for students and teachers

E N D
Using STAAR datato guide learning August 20, 2014 District Professional Learning Session #174
Intended outcomes • Understand the use of thresholds to set student goals and monitor growth • Identify critical TEKS to serve as the focus for learning improvement for students and teachers • Model a process for performing an item analysis of STAAR and other assessment results
lead4ward resources • http://lead4ward.com/resources/ • Released tests and snapshots tab • Process standards – Tools to know, ways to show • Released tests - items organized by SE • STAAR Snapshots – readiness, supporting and process SEs • TEKS Snapshots – Aligned SEs in non-tested grades • TEKS Scaffolding – SEs supporting tested readiness standards from current and prior grade levels
lead4ward resources • http://lead4ward.com/STAARIntervention/ • PW: STAAR-Ready • Original ppt presentation • Original handout
Understand the use of thresholds to set student goals and monitor growth Objective 1
STAAR Performance Standards Satisfactory Advanced Level I Unsatisfactory Performance “Inadequately Prepared” Level II Satisfactory Performance “Sufficiently Prepared” Level III Advanced Performance “Well Prepared”
Performance Standards and thePhase-in of STAAR Recommended 2016? Phase 2 2015? Phase 1 2011-12 2012-13 2013-14
STAAR Performance Standards Satisfactory Advanced Level I Unsatisfactory Performance “Inadequately Prepared” Level II Satisfactory Performance “Sufficiently Prepared” Level III Advanced Performance “Well Prepared” P1 P2 Final
1 What score is needed to pass grade 5 math in 2015?
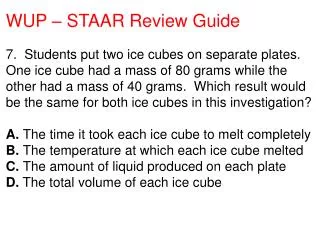
Psychometric Aside: Test equating Performance standard = 1489 scale score points (1489 “units” of math knowledge & skill) 2014 27 items 1489
Psychometric Aside: Test equating Performance standard = 1489 scale score points (1489 “units” of math knowledge & skill) 2015 28 items 1489 Items are less difficult
Psychometric Aside: Test equating Performance standard = 1489 scale score points (1489 “units” of math knowledge & skill) 2015 26 items 1489 Items are more difficult
1 ≈ 55% ≈ 65% ≈ 75% ≈ 85% Think state, act local
3 Really Well Prepared (Exceed Progress) Goal for highest performing students (2 points Index 2) Well Prepared (Advanced Performance) Meeting Level III Performance (Index 2 and Index 3) Sufficiently Prepared (Gr. 3-8 Level II Final) Likely to pass STAAR at final standard (Index 4) Sufficiently Prepared (Level II Phase 2) Likely to pass STAAR this year Knows more than half the content OR Knows most but can’t apply Getting There
Let’s PLAY SH O W D O W N or Fib Fact
Fib Fact 1 = Fact; 2 = Fib All students can exceed progress and earn 2 points for your campus in Index 2 Fact
Index 2: Student progress Grade 3 Math Grade 4 Math Top performing students receive 2 pts (0-2 incorrect) 1677 Exceeded Progress 2 points for campus 148 pts Level III Met Progress 1 point for campus Level II Final 70 pts 1599 1529 Did Not Meet Progress 0 points for campus <70 pts Level I Students in guessing range earn 0 points
Student progress with thresholds Grade 3 Math Grade 4 Math 95% 85% Exceeded Progress Level III Leveling Up 75% or more Level II Final Met Progress <75% 75% Did Not Meet Progress Level I
T H R E S H O L D S STAAR 2014 Goal for 2015 Leveling Up 3
Met Progress What do they all have in common? 5
Exceeded Progress What do they have in common?
Exceeded Progress Well almost… but…
Should Ava have the same Local Assessment performance goals as Michael? STAAR Leveling Up Unit 1 Unit 2 5
Identify critical TEKS to serve as the focus for learning improvement for students and teachers Objective 2
Using Heat MapsFOCUS How did we do?
Start with what we are helping kids learn…the TEKS Readiness Supporting Process
Readiness Standards≈ 30% of assessed TEKS≈ 65% of STAAR BROADand DEEP ideas IN-DEPTH instruction Concepts Complexity 9
1 + 1 + 1= Benchmark Test 9
Identifying focus standards • Compare 2013 STAAR to 2014 STAAR • Classify readiness and process standards • Increase/decrease of more than 5 points • Greater than/less than campus target • Identify areas of strength and concern • Select standards for teacher learning and student growth • Most customarily an August activity
Subtract Map How? Select Commit
Things we will need • 2013 and 2014 STAAR results, analysis by content and process SEs • Aware Heat Maps • District produced item analysis • Performance analysis sheet • Mapping standards sheet
For Teachers Learn the Low For Students Engage the Emerging 6.1B 6.2C 6.8B 6.2E 6.4A 6.2B 6.3C 6.5A 6.6C All of us helped more kids OR One of us figured it out! 6.10D Not so positive Positive outcomes 16 p. 40
For Teachers Learn the Low What might teachers want to learn?
For Teachers Learn the Low For Students Engage the Emerging 6.1B 6.2C 6.8B 6.2E 6.4A 6.2B 6.3C Pick 3 6.5A 6.6C Pick 3 6.10D Not so positive Positive outcomes 16 p. 40
Subtract Map Select Commit
6.4A 4 6 12 1 3 5 6.5A 6.8B 2 11 14 6.2B 6.6C 6.2C • Questions to consider • How have these standards been taught and assessed in the past? • What will need to be learned by teachers? • How will student tasks be modified this year to better align with STAAR? 16 p. 40
Process StandardsAssessed in Context STAAR process standards are assessed with Readinessor Supporting Standards in the same question (i.e. double coded). • ≥75% questions in Math (Grades 3-8) • ≥40% questions in Science • ≥30% questions in Social Studies ≈ 82% ≈ 60% ≈ 55% ≈ 50% Fig. 19 • Reading?
Process Standards… “Game Changers” Potential Rigor… Cause/Effect Compare/Contrast Predict 8.5 (E) identify the foreign policies of presidents Washington through Monroe and explain the impact of Washington's Farewell Address and the Monroe Doctrine; Readiness Standard RIGOR IDENTIFY and EXPLAIN 8.29 (B) analyze information by sequencing, categorizing, identifying cause-and-effect relationships, comparing, contrasting, finding the main idea, summarizing, making generalizations and predictions, and drawing inferences and conclusions;
Process Standards…“Game Changers” Potential Rigor… Cause/Effect Compare/Contrast Predict Which of the following foreign policies are best associated with Presidents Washington through Monroe? IDENTIFY and EXPLAIN RIGOR What issues are common in both Washington’s Farewell address and the Monroe doctrine?