Download
1 / 16
160 likes | 165 Views
This text discusses the importance of reducing uncertainty in measuring and monitoring forest degradation, particularly in the context of IPCC and UNFCCC. It explores the use of remote sensing data and aerial imagery to improve data certainty and accuracy in assessing forest degradation. The text also emphasizes the need to increase certainty in activity data and emission factors for better forest degradation monitoring.

E N D
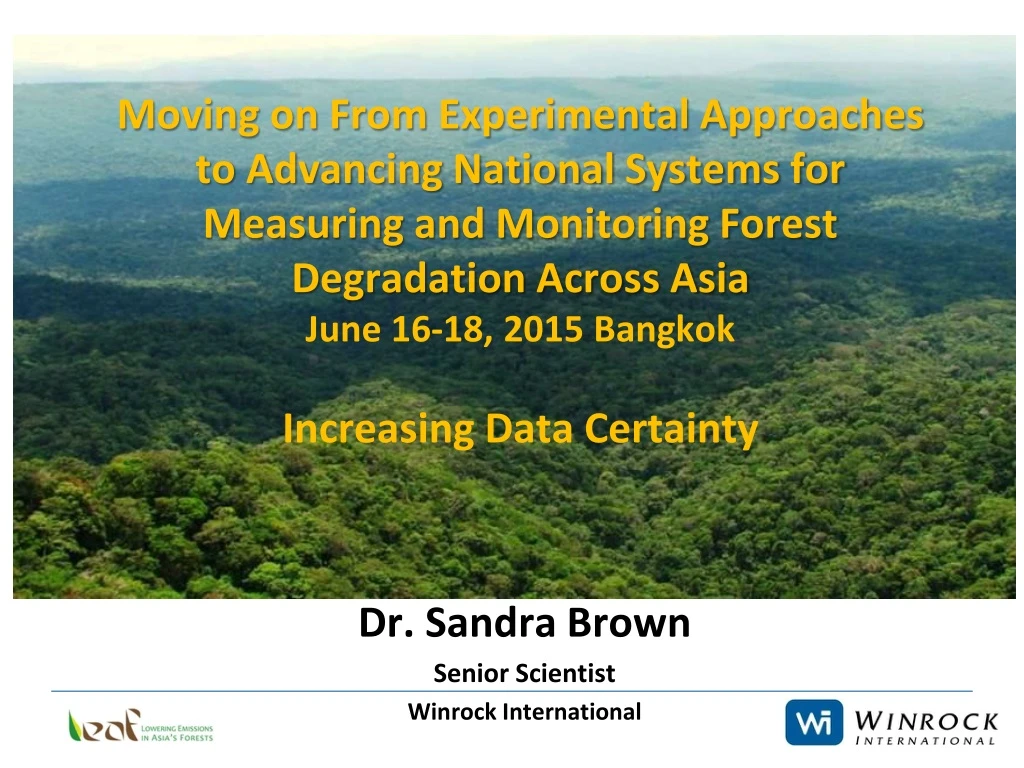
Moving on From Experimental Approaches to Advancing National Systems for Measuring and Monitoring Forest Degradation Across AsiaJune 16-18, 2015 BangkokIncreasing Data Certainty Dr. Sandra Brown Senior Scientist Winrock International
What is uncertainty Uncertainty is the lack of knowledge of the true value of a parameter (e.g., area, carbon stock, EF) Assessing uncertainty is fundamental in the IPCC and UNFCCC contexts: the IPCC defines greenhouse gas (GHG) inventories consistent with “good practice” as those which “contain neither over- nor underestimates so far as can be judged, and in which uncertainties are reduced as far as practicable.” Monitoring plans should be designed to meet a targeted or required level of certainty and to meet international standard of representative, unbiased, consistent, transparent, and verifiable
95% Confidence interval as a measure of uncertainty • Uncertainty is usually expressed by a 95% confidence interval: • 95% of confidence intervals constructed using samples obtained with the same sampling design will include the true value. • If the area of forest land converted to cropland (mean value) is 100 ha, with a 95% confidence interval ranging from 80 to 120 ha, the uncertainty in the area estimate is ±20%. • The 2.5th percentile is 80 and the 97.5th percentile is 120. 120 100 110 80 90 Source: IPCC GPGLULUCF
A challenge for forest degradation if using remote sensing data—need to identify anthropogenic and not confuse with natural mortality For other types of AD data (e.g. timber production or firewood/charcoal use) will need to rely on official statistics or surveys—raises questions of reliability Increasing certainty in activity data
Examples of remotely sensed data for use in monitoring logging Can see logging activity but not tree gaps Landsat imagery Can see tree gaps Worldview-0.6 m 20 cm resolution aerial imagery Can see more detail on roads and decks
Can reduce uncertainty in identifying logging damage with high resolution aerial imagery Resolution of 15-20 cm Active concessions in blue
RapidEye (5 m)vs. GeoVantage Aerial Photography (~0.25 m) Degraded polygon identified in RapidEye Same polygon identified in GeoVantage imagery
1998 2000 Selective Selective logging and burning logging 1999 2001 Old selective logging and burning Old Selective logging Landsat false color composite (R5, G4, B3) Visual interpretation of forest degradation • Defining the boundary between degraded and undisturbed forests is subjective. • Old forest degradation scars cannot be detected visually. • Forest degradation signal disappears fast making visual interpretation challenging Logging and fire in Brazilian Amazon GOFC-GOLD Sourcebook, and Carlos Souza et al.
Uncertainties in land area • An estimate of area and/or area change typically results from analysis of remote-sensing imagery • Such maps are subject to classification errors that introduce bias into estimations. • A suitable approach is to assess the accuracy of the map and use the results of the accuracy assessment to adjust the area estimates. • Assessment is done via “ground-truthing”—either actually on ground or via very high resolution aerial imagery • Adjusting area estimates on the basis of a rigorous accuracy assessment must be used to improve certainty over simply reporting the areas of map classes
Accuracy Assessment using aerial imagery sampling Advantages of aerial imagery for accuracy assessment: • Provides random sample that covers forest and forest change • System adaptable to suit local conditions – i.e. cloud cover • Low cost compared to ground data Sampling flight lines over Guyana Indufor and GFC; and courtesy Dr. P. Watt
To identify low to medium intensity forest degradation using remote sensing data need to use very high resolution imagery on annual timescales—resolution of preferably < 1 m Medium resolution imagery can be useful for identifying where higher intensity of degradation is occurring that creates a lot of infrastructure (e.g. large network of skid trails and roads) Need to implement an accuracy assessment —ground-truthing is a must but can use aerial imagery of 15-20 cm resolution captured with a well-designed sampling plan For other types of AD data (e.g. timber production or firewood/charcoal use) will need to rely on official statistics or surveys—raises questions of reliability What is bottom line for AD?
Uncertainty in estimating emission factors • Uncertainty consists of: • Bias or systematic error (lack of accuracy) –caused by flaws in the measurements or sampling methods or from use of an allometric equation that is unsuitable • Random error (lack of precision) is a random variation above or below a mean value, also known as sampling error—it cannot be fully avoided but can be reduced e.g. by stratifying and increasing the sample size • Measurement error • Model or regression error
How to reduce sampling error • Sampling error reflects the variability in the estimate due to measuring only a subset of the population of interest • Common target for precision is a 95% Confidence interval of ±10-15% of the mean • Sampling error is a the largest source and implementation of a statistically well-designed plan will enable the above precision target to be met • Plot size and distribution must adequately and efficiently capture spatial variability • The distribution of all size classes of trees must be adequately sampled—the sample design must ensure that the distribution of large diameter trees is well captured (most biomass is in large DBH trees)
How to reduce measurement, model, & analysis errors • Making mistakes in measurement and recording during field inventory and subsequent data entry and analysis happens—to reduce error need to: • Need to develop Standard Operating Procedures (SOPs) for all data collection and data analysis and field staff to be trained in their use • Data collection and analysis should include quality assurance/quality control (QA/QC) measures to reduce bias and enhance accuracy, including: • Use of robust allometric models to estimate biomass—ensure contain full range of size classes, include DBH, wood density and height (or proxy) as parameters, contain large sample size (e.gChave et a 2014 >4,000 individuals) • Verifying methods used to collect field data and data entry & analysis
Need a statistically well designed sampling plan for obtaining field data—need to minimize sampling error Must develop and implement SOPs and ensure all teams are well trained Must develop and implement QA/QC plans for all steps in process Bottom line for increasing certainty in emission factors


![[PDF] Free Download Tailspin By Sandra Brown](https://cdn4.slideserve.com/7969159/slide1-dt.jpg)
![[PDF] Free Download Outfox By Sandra Brown](https://cdn4.slideserve.com/8417659/slide1-dt.jpg)
![[PDF] Free Download Outfox By Sandra Brown](https://cdn4.slideserve.com/9039871/slide1-dt.jpg)