Download
1 / 24
260 likes | 476 Views
The Impact and Mitigation of Ionosphere Anomalies on Ground-Based Augmentation of GNSS. Sam Pullen, Young Shin Park, and Per Enge Stanford University spullen@stanford.edu. 12th International Ionospheric Effects Symposium (IES 2008) Alexandria, Virginia Session 4A, Paper #6 14 May 2008.

E N D
The Impact and Mitigation of Ionosphere Anomalies on Ground-Based Augmentation of GNSS Sam Pullen, Young Shin Park, and Per Enge Stanford University spullen@stanford.edu 12th International Ionospheric Effects Symposium (IES 2008) Alexandria, Virginia Session 4A, Paper #6 14 May 2008
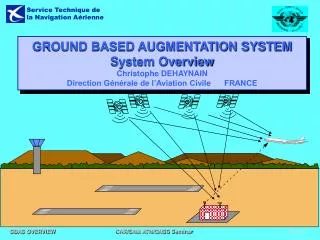
VHF Data Broadcast Significance of Ionosphere Spatial Decorrelation in LAAS/GBAS Ionospheric delay Vertical Alert Limit (VAL) Broadcast Standard Deviation (Sigma) of Vertical Ionosphere Gradient VPL svig Vertical Protection Level (VPL) VAL LAAS Ground Facility Source: Jiyun Lee, IEEE/ION PLANS 2006 Impact and Mitigation of Ionosphere Anomalies on GBAS
Severe Ionosphere Gradient Anomaly on 20 November 2003 Impact and Mitigation of Ionosphere Anomalies on GBAS
35 30 25 20 15 10 5 0 0 50 100 150 200 250 300 350 Moving Ionosphere Delay “Bubble” in Ohio/Michigan Region on 20 Nov. 2003 Data from 7 CORS stations in N. Ohio and S. Michigan Initial upward growth; slant gradients 60 – 120 mm/km Sharp falling edge; slant gradients 250 – 330 mm/km Slant Iono Delay (m) Slant Iono Delay (m) “Valleys” with smaller (but anomalous) gradients WAAS Time (minutes from 5:00 PM to 11:59 PM UT) Impact and Mitigation of Ionosphere Anomalies on GBAS
Validation of High-Elevation Anomaly Reported by FAATC (SVN 38, ZOB1/GARF, 20/11/03) Maximum slope from L1-only data 412.8 mm/km Impact and Mitigation of Ionosphere Anomalies on GBAS
IPP Tracks of (Low-Elevation) GPS SVN 26 (20 Nov. 2003; 20:30 ~ 21:30 UT in OH-MI) Satellite Direction of Motion Iono. Front at 21:00 Impact and Mitigation of Ionosphere Anomalies on GBAS
SVN 26 Slant Delays Observed at WOOS, FREO, LSBN, and GARF FREO • Sufficient similarity between the two sets of ionosphere delaysexists • Lines-of-Sight from FREO and WOOS are within the bulk of the “enhanced” ionosphere gradient WOOS LSBN GARF GUST Impact and Mitigation of Ionosphere Anomalies on GBAS
DF Slope L1 Slope Severe Ionosphere SlopeValidated with L1 dataWOOS and GARF,SVN 26, 20 Nov. 2003 Estimated Slope using L1 Code-minus-Carrier Data • Maximum Validated Slope: ~ 360 mm/km • This observation window is very close to the time that peak ionosphere gradients were observed on higher-elevation satellites. L1-L2 slope L1-only slope Impact and Mitigation of Ionosphere Anomalies on GBAS
Ionosphere Anomaly Front Model:Potential Impact on a GBAS User Simplified Ionosphere Front Model: a ramp defined by constant slope and width Front Speed 200 m/s Front Slope 425 mm/km LGF IPP Speed 200 m/s Front Width25km Airplane Speed ~ 70 m/s (synthetic baseline due to smoothing ~ 14 km) Max. ~ 6 km at DH GBAS Ground Station Stationary Ionosphere Front Scenario: Ionosphere front and IPP of ground station IPP move with same velocity. Maximum Range Error at DH: 425 mm/km × 20 km = 8.5 meters Impact and Mitigation of Ionosphere Anomalies on GBAS
Resulting Revised (and Simplified) Ionosphere Anomaly Threat Model for CONUS 425 Flat 375 mm/km Flat 425 mm/km 375 Linear bound: ybnd(mm/km)=375 + 50(el-15)/50 300 (note: plot not precisely to scale) Slant iono. gradient bound (mm/km) 200 Also bounds on: Front speed wrt. ground: ≤ 750 m/s Front width: 25 – 200 km Total differential delay ≤ 50 m 100 5 15 30 45 65 90 SV elevation angle (deg) Impact and Mitigation of Ionosphere Anomalies on GBAS
0.14 0.12 0.1 0.08 0.06 0.04 0.02 0 Semi-random Results for Memphis LGF at 6 km DH RTCA-24 Constellation; All-in-view, all 1-SV-out, and all 2-SV-out subsets included; 2 satellites impacted simultaneously by ionosphere anomaly Most errors are exactly zero due to, e.g., CCD detection and exclusion before anomaly affects users, but all zero errors have been removed from the histogram. PDF Worst-case error, or “MIEV”, is 41 m 0 5 10 15 20 25 30 35 40 45 User Vertical Position Error (meters) Impact and Mitigation of Ionosphere Anomalies on GBAS
Simplified Flow Chart for Real-Time Inflation LAAS Ground Facility (LGF) Real-Time Geometry Screening Ionosphere Anomaly Threat Model Airport Approach Layout and Ops. Limits SV almanac and current time Worst-Case Ionosphere Error Determination Subset Geometry Determination Approach Hazard Assessment (N-2 constraint) Compare MIEV to Ops. Limits for Available Subset Geometries Inflated spr_gnd, svig, and/or P-values LGF acts to make potentially unsafe user geometries unavailable. Iterative Sigma/P-Value Parameter Inflation Do Any Unsafe Subsets Exist? Yes No Approved Sigmas/P-Values for Broadcast by VDB References: J. Lee, et al., Proceedings of ION GNSS 2006 S. Ramakrishnan, et al., Proceedings of ION NTM 2008 Impact and Mitigation of Ionosphere Anomalies on GBAS
MIEV for Memphis at 6 km Prior to Inflation 45 WC error from histogram on slide 11 40 35 30 OCS Error Limit at DH MIEV (m) 25 20 15 10 0 50 100 150 200 250 300 Time Index (5-min updates) Impact and Mitigation of Ionosphere Anomalies on GBAS
-4 x 10 5.5 5 4.5 4 3.5 3 2.5 2 1.5 1 0 50 100 150 200 250 300 Inflated P-values for Memphis at 6 km from LGF (PA = 0.17, PB = 0.27 m/km) Inflated P-values (m/m) Time Index (5-min updates) Impact and Mitigation of Ionosphere Anomalies on GBAS
MIEV for Memphis at 6 km after P-Value Inflation 30 28 26 24 MIEV (m) 22 20 18 16 Inflated MIEV (m) OCS Limit (m) 14 0 50 100 150 200 250 300 Time Index (5-min updates) Impact and Mitigation of Ionosphere Anomalies on GBAS
Protection Levels for Memphis at 6 km from LGF 8 Significant margin (> 2.5 meters) relative to 10-meter FASVAL at DH Uninflated VPL H0 Uninflated VPL 7 eph Inflated VPL eph 6 Protection Level (m) 5 4 3 2 0 50 100 150 200 250 300 Time Index (5-min updates) Impact and Mitigation of Ionosphere Anomalies on GBAS
Summary • Ionosphere anomaly threat model for CONUS has been developed based on validated ionosphere storm gradients discovered since April 2000 • Maximum ionosphere-induced errors are caused by worst-case extrapolation of events on 20 Nov. 2003 • Given lack of ground system observability, mitigation strategy is to inflate broadcast parameters to exclude potentially unsafe subset geometries from use • This requires GBAS ground station to vary inflation parameters in real time. • Two methods (using inflated spr_gnd and P-values that vary across satellites, as shown here, and using inflated svig values) have been demonstrated that retain near-100% availability for RTCA-24 constellation and typical actual constellations (with no satellite outages). Impact and Mitigation of Ionosphere Anomalies on GBAS
Backup Slides • Backup slides follow… Impact and Mitigation of Ionosphere Anomalies on GBAS
Outline • Nominal Ionosphere Spatial Decorrelation over Short Baselines • Anomalous ionosphere spatial decorrelation • Examples from October and November 2003 storms in CONUS • Worst-case range-domain errors for GBAS users • Ionosphere Spatial Anomaly “Threat Model” • Real-Time GBAS/LAAS Threat Mitigation • Impact of code-carrier divergence (CCD) monitoring • Simulation of worst-case vertical position errors • “Geometry Screening” by broadcast parameter inflation • Resulting impact on CAT I GBAS user availability Impact and Mitigation of Ionosphere Anomalies on GBAS
svig Overbound Results from Station Pair Method JPL post-processed CORS “truth” data Insufficient number of samples to obtain reliable statistics Solid lines show svig+ |vig|. Inflation factors are 2.2 ~ 4.1 Impact and Mitigation of Ionosphere Anomalies on GBAS
Note: CORS stations in CONUS are typically 30 – 100 km apart. Iono. Anomaly Event Verification Methodology Impact and Mitigation of Ionosphere Anomalies on GBAS
Worst-Case Ionosphere Front Scenarios Iono Front i(aircraft) Vi,Proj i(LGF) Vfront Runway LGF j (LGF) j(aircraft) Vj,Proj Generate two sub-cases for each SV pair (i,j) “iworst” and “j worst” “i worst”=> Apply worst range error to SV iand resulting error to SV j “j worst”=> Apply worst range error to SV jand resulting error to SV i Impact and Mitigation of Ionosphere Anomalies on GBAS
6 7 8 9 10 11 12 13 14 Proposed Worst-Case Ionosphere Error Limits 160 140 99% TSE 120 95% TSE 100 99.9% TSE Worst-Case Ionosphere Error Allowed (m) 80 60 40 28-meter constraint at 6 km 20 Distance from LGF (km) DH location Impact and Mitigation of Ionosphere Anomalies on GBAS
Notes on Real-Time Ground-System Parameter Inflation • Real-time parameter inflation is fundamentally providing integrity in the position domain • The real-time satellite-specific P-value inflation method shown here achieves 100% availability for all-in-view geometry (for RTCA-24 constellation) at 4 of 5 airports tested (MEM, DEN, DFW, MCO) • One exception (DCA) is shown on following slide • For P-value inflation approach, inflation required for 6-km separation dominates that required for larger separations • However, since thousands of subset geometries must be checked at every real-time parameter update interval, simpler methods that retain acceptable availability are also of interest Impact and Mitigation of Ionosphere Anomalies on GBAS