Download
1 / 55
550 likes | 668 Views
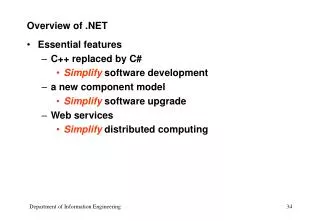
Overview and Recent Trends of Petri Net Research. Tadao Murata University of Illinois at Chicago murata@uic.edu Romanian Academy of Science Bucharest, Romania March 24, 2005. Plan of Talk. Overview of Petri Net Research

E N D
Overview and Recent Trends of Petri Net Research Tadao Murata University of Illinois at Chicago murata@uic.edu Romanian Academy of Science Bucharest, Romania March 24, 2005
Plan of Talk • Overview of Petri Net Research • Our Recenet Work: Fast Performance Evaluation Using Fuzzy Logic and Petri Nets • Fuzzy Logic and Soft Computing (SC) • Examples of Possibility Distributions • Probability vs. Possibility • Simple Examples of Performance and Possibility Evaluation by Using Fuzzy Logic and Petri Nets • Degrees of Possibilities for Satisfying Given Specifications • Concluding Remarks
What is a Petri Net? • Petri Nets are a graphical and mathematical modeling tool, • and good for describing and studying information • processing systems that are characterized as being: • Concurrent • Parallel • Asynchronous • Distributed • Non-deterministic • and/or Stochastic
"Three-In-One" Characteristics of Petri Nets • 1) Graphical or Intuitive Model, • 2) Mathematical or Formal Model, and • 3) Can be used as Simulation Tool • An Analogy: A Vehicle that can travel • On Land like a car, • On Water like a boat, and • On Air like an airplane.
Application Areas • Successful application examples are often found in the areas of • Communication protocols and networks, • Performance evaluation of time-critical systems, • Flexible manufacturing systems, • Discrete event control systems, • Business and other work-flow management systems, • System and Computational Biology, etc. • For actual (non-toy) examples of applications, visit, e,g., • http://www.daimi.au.dk/PetriNets/applications/, and • http://www.daimi.au.dk/CPnets/intro/example_indu.html
Analysis Methods • 1) State Equation and Invariants • 2) Reduction Techniques (Expansion for Synthesis) • 3) Use of subgraphs: Siphons, Traps, Handles, Bridges, SM- & MG components, etc. • 4) Reachability (Coverability) Graphs • The first three are applicable to subclasses or with certain conditions, and the forth has the state space explosion problem.
Our Recent Work:Fast Performance Evaluation Using Fuzzy Logic and Petri Nets
Fuzzy Logic is a Main Component of Soft Computing (SC), which is: • A set of methodologies that function effectively in an environment of imprecision and/or uncertainty; • Aims at exploiting the tolerance for “fuzziness” (imprecision, uncertainty, and partial truth) to achieve tractability (or scalability), and low-solution cost. • Methodologies in SC include Fuzzy Logic, Computing with Words, Neurocomputing, Probabilistic Reasoning, etc. • *[Zad94] Lotfi A. Zadeh, "Fuzzy Logic, Neural Networks, and Soft Computing," Comm. of ACM, vol.37, pp.77-84, 1994
Fuzzy Set is a Generalization of Crisp Set • Any crisp theory can be generalized to the concept • of a fuzzy set (from a set): • Membership grade: =0 or 1 v.s, 01 • Crisp, Non-Fuzzy Fuzzy • Linear Nonlinear • Deterministic Non-Deterministic
=1 =0.1 =0.5 Example of a crisp set • The set of people who are 20 years old or younger • The set of “younger people” =1 =1 inside =0 outside the set =1 for 15 years old =0.5 for 30 years old =0.1 for 40 years old
Fuzzy Timing is a Generalization of Deterministic Timing • Without loss of generality, we can use trapezoidal fuzzy time functions or possibility distributions*, using 4 parameters, p(t) = (p1, p2, p3, p4). • Note: S (probabilities) = 1, but S (possibilities) ≠ 1 • Special Cases: 1. Deterministic Timing if p1= p2= p3= p4 (=p) 2. Deterministic Time Interval if p1= p2 and p3= p4 3. Triangular Distributions (Fuzzy Numbers) if p2= p3 • * This is not restriction. Any possibility distributions can be used in this method. 1 1 p p p p t p p p p t 0 0 = 1 2 3 4 1 2 3 4 (a) (b)
Typical Building Blocks of Possibility Distributions • Normal Possibility Distribution by Triangular • (Trapezoidal) or Exponential Functions Special Cases Special Cases (x)=e-1/2((x-c)/)2 1 20 0 100 points C=60
1 0 20 60 100 points Example 1: Possibility distribution of a typical exam in my class • It is a normal probability distribution which can be approximated by the triangular possibility distribution: (1, 2, 3, 4) = (20, 60, 60, 100) points.
p p p p ( , , , ) = (20, 30, 40, 120) minutes 1 2 3 4 1 0 20 30 40 120 minutes Approximation using 6 trapezoidals 1 1 2 3 4 5 6 0 20 30 40 120 minutes Example 2: Possibility distribution of driving time from my home to work (20 miles).Note that arbitrary possibility distributions can be decomposed into a set of trapezoidal distributions.
1 0 1 10 100 sec 5 Example 3: Possibility distribution of time to download a “big” file (of 1Mb to 1Gb) • (1, 2, 3, 4) = (1, 5, 10, 100) sec.
Example 4: Possibility distribution of the total # of hours spent by a student on HWs • HW.course1 HW.course2 HW.course3 = (1, 2, 3, 4) (2, 3, 3, 4) (2, 2, 3, 3) = (5, 7, 9, 11) hours. 1 1 1 0 1 2 3 4 0 2 3 4 0 2 3 1 = 0 5 7 9 11 hours
1 0 1 2 3 10 minutes Fuzzy vs. Vague • A proposition is fuzzy if it contains terms that are labels of fuzzy sets, such as possibility distributions: e.g., "I will be back in a few minutes.“The possibility distribution of "a few minutes" is shown below. • But “I will be back sometime”is vague, unless the possibility distribution of ”sometime” is given.
1 0 20 40 yr. old 1 0 20 40 yr. old Negation of a Proposition and its Possibility Distribution • The possibility distribution of "young": • The possibility distribution of "not young":
Computing with Words • In a broader sense, computing with words is a computational theory of perceptions. • It is a methodology in which the objects of computation are words such as: a few days, young, rich, not very likely, …, and propositions in natural languages such as:It takes a few days, I'll do it in the near future, The stock price will go up eventually, etc. • In this talk we restrict the perception related to time or delay(performance).
Computing Over-all Possibilities: Example • We have a project which consists of three steps to do in sequence. Each step takes a few days to complete. What is the possibility to finish this project within the deadline of 9 days? • Solution: • Suppose that the possibility distribution of a few days is given by (1,2,3,5) days. Then 3 steps take 3(1, 2, 3, 5) = (3, 6, 9, 15) days. Thus the possibility distribution to finish this project is: 1 0 3 6 9 15 days
(Continued from the preceding page) • The possibility to finish this project in 9 days is computed by the radio of the areas: = Area A (the part of the trapezoidal area before 9 days) / Area B (the entire trapezoidal area) = (1.5 + 3)/(1.5 + 3 + 3) = 4.5/7.5 = 0.6 or 60 %. Step 1 Step 2 Step 3 Deterministic: 3 days + 3 days + 3 days = 9 days
Computing Possibilities of Satisfying Maximum Tolerable Skew in Multimedia Synchronization • Given the following Dynamic Parameters for a • Multimedia (Audio and Video) Application: • Throughput: 10 images per sec; • Max. Tolerable jitter on audio or video: 10ms; • Max. tolerable skew between audio and video 50ms.
1 1 0 0 90 360 100 400 110 440 ms ms (Continued from the preceding page) • Normal playout duration per image=100ms; • Possibility distribution = (90, 100, 100, 110)ms. • Synchronizing every 4 audio-video unit gives the • playout duration for 4 units = 4X(90,100,100,110)=(360, 400, 400, 440)
(Continued from the preceding page) • The max possible skew=440-360=80 ms or possibility distribution is (-80, 0, 0, 80) ms • The degree of possibility that the max skew requirement 50ms is satisfied. • The shaded Area between t=50 and -50 / Area of the whole triangular = 0.859375 1 50 0 -80 0 80 -50 t
(Continued from the preceding page) • Thus, synchronizing every 4 units yields the 85.9% possibility that the skew between video and audio will not exceed 50 ms. Thus the requirement is satisfied 85.9% of time. • Synchronizing every 2 units yields the possibility distribution of the skew = 2x(90,100,100,110) =(180,200,200,220)ms: Max. possible skew is 220-180 = 40ms < 50ms limit. Thus the requirement is satisfied 100% this time.
Probability vs. Possibility • Probabilities are normalized: (probabilities) = 1, but (possibilities) 1. • Probability theory offers no techniques for dealing with fuzzy quantifiers like few, many, most, several, …. • Probability theory does not provide a system for computing fuzzy probabilities expressed as likely, unlikely, not very likely, etc.
Probability theory is much less effective than fuzzy logic in those fields where: • 1) The knowledge of probability is imprecise and/or • incomplete; • 2) The systems are not mechanistic (have no equations governing system behaviors); and • 3) Human reasoning, perceptions and emotion do play an important role. • This is the case, in varying degree, in expert systems, • economics, speech recognition, analysis of evidence, • etc.
Petri Net Model of a Job-Shop • A job shop has a machine (Pfree) which can process two types of job a orb. e P e P 1a 1a 2a out-a a P free b e P e P 1b 1b 2b out-b
Meanings of Places and Transitions • Placea gets a token when the request for job a arrives. • Placeb gets a token when the request for job b arrives. • Place Pfree gets a token when the machine is available. • Transition e1a or e1b represents job a or b gets the machine; • Transition e2a or e2b represents job a or b performs the job and release the machine, respectively; and • Place Pout-a (or Pout-b) gets a token when Job a (or b) completed its job, respectively.
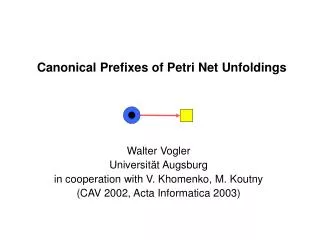
Fuzzy-Timing Petri Net (FTPN) Model of a simple resource sharing system t P t P 1a 1a 2a out-a (0,0,0,0) (4,5,7,9) P a t d ( t ) d ( ) 1a 2a t d ( ) (4,5,7,9) 2a P free t d ( ) (4,5,7,9) 2b d ( t ) d ( t ) 1b 2b P b (0,0,0,0) (4,5,7,9) t P t P 1b 1b 2b out-b
Mutual Exclusion Model • This Petri net model also represents a mutual exclusion in which a common resource Pfree is shared by two processes a and b, where: • Pa (or Pb): process a (or b) is waiting; • P1a (or P1b): process a (or b) is using the resource • Pout-a (or Pout-b): Process a (or b) finishes using the resource Pr; • e1a (or e1b): process a (or b) gets the resource; • e2a (or e2b): process a (or b) releases the resource.
Non-Fuzzy Case • Suppose job a arrives at 3 sec and job b arrives at 5 sec. The machine is available at 0 sec; it takes zero time to get the machine (d1 = 0), takes 2 sec to perform each job (d2 = 2); and takes another 2 sec to clean and return the machine (d3 = 4). • Using the First-Come-First-Serve policy, job a will be completed at 3 + 2 = 5 sec, and job b will be completed at max{(3+4), 5}+2 = 7+2 = 9 sec.
Fuzzy-Timing Case • Suppose that the request of jobs a and b arrive at 32 sec and 52 sec, respectively, i.e. their possibility distributions are given below. Job a Job b 1 sec 0 1 3 5 7
Case 1: Job a’s request arrives before Job b’s. • Suppose d1 = 0 sec and d2 = d3 = (4,5,7,9). • Then job a is completed at: (1,3,3,5) (4,5,7,9) = (5,8,10,14)and job b is completed at: (5,8,10,14) (4,5,7,9) = (9,13,17,23) Job a 1 1 sec 0 5 8 10 14 Job b 1 1 sec 0 9 13 17 23
1 Job b 2 0.5 sec 0 7 9 11 14 Case 2: Job b’s request arrives before Job a’s. • But there are smaller possibilities that job b is completed before job a: that possibility distribution is given by the intersection of the two possibility distributions of job a and job b arrivals: min{(1,3,3,5), (3,4,4,7)} = 0.5(3,4,4,5). • Therefore, job b could be completed at 0.5(3,4,4,5) (4,5,7,9) = 0.5(7,9,11,14)
1 Job a 2 0.5 sec 0 11 14 18 23 (Continued) Case 2: Job b’s request arrives before Job a’s. • and job a be could be completed at 0.5(7,9,11,14) (4,5,7,9) = 0.5(11,14,18,23): • Since there are two possible orders a-b and b-a in which jobs are completed, we combine the two possibility distributions to get the overall possibility distributions of completing jobs by taking the union (fuzzy max operation) in the next two slides.
Job a 1 1 sec 0 5 8 10 14 1 Job a 2 0.5 sec 0 11 14 18 23 1 0.5 sec 0 5 8 10 11 14 18 23 Union of Job a1 and Job a2
Job b 1 1 sec 0 9 13 17 23 1 Job b 2 0.5 sec 0 7 9 11 14 1 0.5 sec 0 7 9 9 11 13 14 17 23 Union of Job b1 and Job b2
23 tp t t ( ) d t = = For Job a * 5 12 . 5 sec a 23 p t t ( ) d 5 23 tp t t ( ) d t = = For Job b * 7 15 . 0 sec b 23 p t t ( ) d 7 (Continued) Defuzzification to get “Average” • “Average” completion times for Job a and Job b can be computed by one of “Defuzzification” methods, e.g. by the Moment Method:
1 area B 0.5 sec 0 5 8 10 11 14 18 23 20 Possibilistic Performance Analysis Examples • 1) If the deadline to finish both jobs a and b is 24 sec, then the possibility to finish both jobs before the deadline is one (100%). • 2) The possibility to finish job abefore the 20 sec deadline ≈ (area B) / (area A) ≈ 92%, where (area B) = the shaded area, and (area A) = the total area under the curve.
1 area B’ 0.5 sec 0 7 9 9 11 13 14 17 23 15 Possibilistic Performance Analysis Examples (Continued) • 3) The possibility to finish job bbefore the 15 sec deadline ≈ (area B’) / (area A’) ≈ 50%, where (area B’) = the shaded area, and (area A’) = the total area under the curve.
Computation Steps in FTPN • 1) Given or compute Fuzzy Time Stamps, pi(t). • 2) Compute Fuzzy Enabling Times by et(t)=latest {pi(t) | i=1,2, …}. • 3) Compute Fuzzy Occurrence Times by ot(t)= min {et(t), earliest {ei(t) | i=1,2, …}}. • 4) Update Fuzzy Time Stamps:ptp(t) = ot(t) dtp(t) = supmin{ot(t1), dtp(t2)}.t=t1+t2 • 5) Repeat the above Steps 1 to 4.
The latest and earliest Operators • latest {pi(t) | i=1,2, …, n}≈ extended max* {pi(t) | i=1,2, …, n} ≈ latest {hi(pi1, pi2, pi3, pi4), i=1,2, …, n} ≈ min{hi} (max{pi1}, max{pi2}, max{pi3}, max{pi4}) i=1,2, …, n • earliest {ei(t) | i=1,2, …, n}≈ extended min* {ei(t) | i=1,2, …, n} ≈ earliest {hi(ei1, ei2, ei3, ei4), i=1,2, …, n} ≈ max{hi} (min{ei1}, min{ei2}, min{ei3}, min{ei4}) i=1,2, …, n • * D. Dubois and H. Prade, “Possibility Theory: an approach to computerized processing of uncertainty”, Plenum Press, 1988
Illustration of the latest operator The red line is latest{1(t), 2(t)} = latest{0.5(0,1,5,6), (1,3,3,4)} = 0.5(1,3,5,6) 2(t) 1(t) 1 0.5 0 1 2 3 6 5 4 t
Illustration of the latest operator (continued) The red line is latest{1(t), 2(t), 3(t)} = latest{0.5(0,1,5,6), (1,2,3,4), (6,7,7,8)} = 0.5(6, 7, 7, 8) 2(t) 3(t) 1(t) 1 0.5 0 1 2 3 6 5 8 4 7 t
Illustration of the earliest operator • o(t)=earliest{e1(t), e2(t), e3(t)} • = earliest{0.5(0,1,6,7), (1,3,3,5), (6,7,7,8)} • = (0,1,3,5) e2(t) e3(t) e1(t) 1 0.5 0 1 2 3 6 5 8 4 7 t
O1(t) 1 0.5 0 1 2 3 6 5 8 4 7 t Finding occurrence times by the min (intersection) operator • o1(t)=min{e1(t), o(t)} • = min{0.5(0,1,5,6), (0,1,3,5)} • = 0.5(0,1,4,5)
Finding occurrence times by the min operator (continued) o2(t)=min{e2(t), o(t)} =min{(1,3,3,5), (0,1,3,5)} = (1,3,3,5) O2(t) 1 0.5 t 8 0 1 2 3 6 4 7 5 o3(t)=min{e3(t), o(t)} = min{(6,7,7,8), (0,1,3,5)}=
Concluding Remarks (1) • The computations involved in the above FTPN method are mostly additions and comparisons of real numbers and do not require solving any equations. Therefore, they can be done very fast. Thus this method is suitable for applications to time-critical systems. • The FTPN method is considered to be complementary to existing probabilistic or stochastic approaches. • The FTPN method is more general but approximate and subjective in many cases.
Concluding Remarks (2) • FTPN and other fuzzy approaches are suitable for : • Complex systems for which complicated mathematical systems must be solved; • Large-scale systems which have intractable computational complexity/cost; and • Applications that involve human descriptive or intuitive thinking. • Fuzzy logic has no memory and lacks learning capabilities. Thus it is good to combine fuzzy logic with neural networks and to work with so-called “neurofuzzy systems”.