Download
1 / 20
200 likes | 381 Views
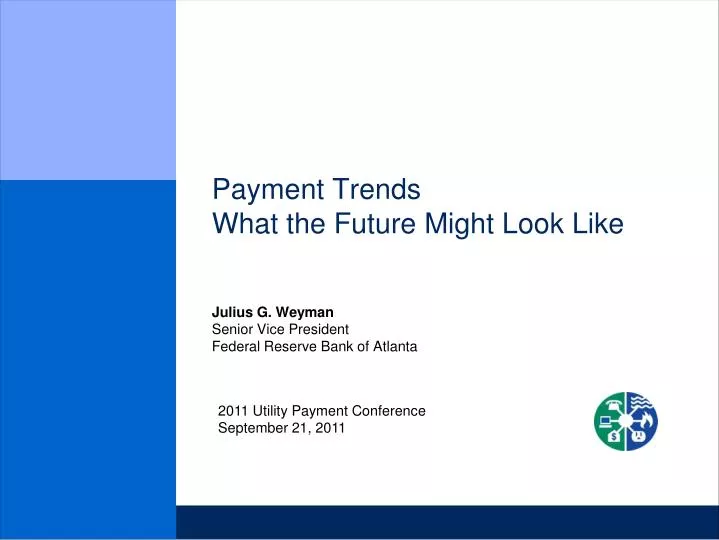
Payment Trends What the Future Might Look Like. Julius G. Weyman Senior Vice President Federal Reserve Bank of Atlanta. 2011 Utility Payment Conference September 21, 2011. Discussion Agenda. Changes in Payment Trends: Results of 2010 Federal Reserve Payments Study

E N D
Payment TrendsWhat the Future Might Look Like Julius G. Weyman Senior Vice President Federal Reserve Bank of Atlanta 2011 Utility Payment Conference September 21, 2011
Discussion Agenda • Changes in Payment Trends: Results of 2010 Federal Reserve Payments Study • Emerging Payments: Rules and Regulations SOURCE: Federal Reserve Payments Study
2010 Federal Reserve Payments Study Background • Fourth in a series of triennial studies to estimate and study trends in noncash payments in the US • Identifies changing trends in: • How payments are made • The dollar distribution of retail payments among the various options • How check writing and clearing has changed • Comprised of three separate studies • Depository Institution Payments Study • Estimates the number and value of various types of transactions from US deposit accounts in 2009 • 1,300 participants, including all of the 50 largest US depository institutions • Electronic Payments Study • Estimates the number and value of various types of electronic payments in the US in 2009 • Respondent base included payment networks, processors, and card issuers • Respondents accounted for over 95 percent of US electronic payments • Check Sample Study • Estimates the distribution of checks by counterparty and purpose SOURCE: Federal Reserve Payments Study
Payments Study Headlines • The number of noncash payments in the United States grew at approximately the same rate between 2006 and 2009 as it did between 2003 and 2006, and the value of noncash payments declined: • Noncash transactions grew 4.6% CAGR while dollar values fell over the same period • Check volume continues to fall at increasing rates from past surveys • Checks written from consumers to businesses fell precipitously • Check clearing has become increasingly electronic • Debit cards are now the most used non-cash payment instrument • Credit card usage shows no growth • Prepaid card usage, particularly open loop prepaid is growing rapidly SOURCE: Federal Reserve Payments Study
Rates of Change in Number of Noncash Payments Total number of noncash payments = +4.6%
Rates of Change in Value of Noncash Payments Total value of noncash payments = -1.6%
Rates of Change in Average Value of Noncash Payments Total value of noncash payments = -5.9%
d In 2009, nearly 80% of noncash payments were electronic; the most used instrument was debit card, eclipsing check Distribution of noncash payments in 2006 and 2009 2006 2009 Checks paid Checks paid Debit card 22% Debit card 26% 32% 35% 5% Prepaid1 4% 18% 23% Prepaid1 15% 20% ACH Credit card ACH Credit card 1 Prepaid includes EBT. SOURCE: Federal Reserve Payments Study
% Cards were used for 60% of noncash transactions but only 5% by value; ACH and check were the dominant instruments by dollar value Distribution of noncash payments in 2009 Number Value Debit card Credit card Checks paid 2% Debit card 22% 3% Checks paid 35% 44% 5% Prepaid1 51% ACH 18% 20% 0% ACH Prepaid1 Credit card 1 Prepaid includes EBT. SOURCE: Federal Reserve Payments Study
8 Number of checks written, paid, or converted to ACH billions Check writing continued to decline since the last study, but the growth of check conversion to ACH slowed dramatically CAGR (2003-06) CAGR (2006-09) 37.6 0.3 (1%) 33.1 2.6 (8%) 27.8 Checks written 3.3 (12%) Converted to ACH 37.3 (99%) 30.5 (92%) 24.5 (88%) Paid as checks 2003 2006 2009 Figures may not add due to rounding. SOURCE: Federal Reserve Payments Study
9 Remittance POS Remittance / POS Other Consumer-to-business checks are declining at a faster rate than business checks Number of checks written by counterparty1 billions 2006 (total = 33.1) 2009 (total = 27.8) CAGR (2006-09) 1.6 C2B 10.7 4.4 1.9 17.0 8.6 12.3 2.0 1.8 1.2 B2B 5.4 8.3 6.0 7.9 1.1 0.6 B2C C2C Figures may not add due to rounding. 1 Estimates are based on a random sample of checks processed by the Viewpointe archive member banks. Data includes banks that participated in both the 2006 and 2009 Federal Reserve Check Sample Study. “C” refers to consumer. “B” refers to businesses, nonprofits, or government organizations. “P2P” refers to person-to-person. SOURCE: Federal Reserve Payments Study
% Number of ACH payments by type billions A slowdown in check conversion growth slowed overall ACH growth;other forms of ACH grew more quickly than check conversion CAGR (2003-06) CAGR (2006-09) ACH 19.1 3.3 (17%) Converted checks 14.6 2.6 (18%) 8.8 0.3 (4%) 15.8 (83%) Other ACH 12.0 (82%) 8.4 (96%) 2003 2006 2009 Figures may not add due to rounding. SOURCE: Federal Reserve Payments Study
Number of credit card payments vs. other noncash payments billions Credit cards were the only electronic instrument to show usage decline and fell to 20% of total noncash payments CAGR (2003-06) CAGR (2006-09) Noncash 109.0 21.6 (20%) 95.2 Credit card1 21.7 (23%) 81.4 19.0 (23%) Other noncash payments 87.4 (80%) 73.5 (77%) 62.5 (77%) 2003 2006 2009 Figures may not add due to rounding. 1 Credit card includes general purpose and private label credit card transactions. 2 The growth rate has been adjusted for comparability, because the 2004 study did not attempt to estimate all 2003 prepaid card transaction volume. SOURCE: Federal Reserve Payments Study
Number of debit card payments by type billions Debit card use continued to grow at double-digit annual rates; PIN debit increased to nearly 40% of total debit transactions CAGR (2003-06) CAGR (2006-09) Debit card1 37.9 14.5 (38%) PIN 25.0 9.4 (37%) 15.6 5.3 (34%) 23.4 (62%) Signature 15.7 (63%) 10.3 (66%) 2003 2006 2009 Figures may not add due to rounding. 1 Debit card includes transactions funded from demand deposit accounts and does not include “prepaid” debit. SOURCE: Federal Reserve Payments Study
Number of “prepaid” debit payments by type billions Use of prepaid debit cards, including EBT, grew faster than other noncash payments; open-loop card use grew most quickly CAGR (2006-09) Prepaid debit 1 6.0 1.3 (22%) General purpose2 3.3 2.7 (45%) 0.3 (9%) Private label2 1.9 (58%) 2.0 (33%) EBT 1.1 (33%) 2006 2009 Figures may not add due to rounding. 1 Prepaid debit includes payments made by prepaid instruments purchased by households and payments by cards funded by US firms or government agencies to disburse payments or benefits to households (e.g., payroll cards, EBT); includes single-use and reloadable cards, but excludes transit cards, toll way systems and phone cards. 2 General purpose prepaid instruments are network branded by either credit card or PIN networks (e.g.,payroll or prepaid banking cards). Private label transactions are prepaid cards which are limited in usage to one or several merchants (e.g., gift cards). SOURCE: Federal Reserve Payments Study
Online bill pay from financial institution websites and far field RFID (e.g., transit tollways) were the most used alternative applications • Other 2009 payments applications measured • billions; average in USD Each of these applications leverages other payment types, the use of which is estimated by the 2010 Federal Reserve Payments Study 1 Online bill pay from FI or aggregator websites that are processed by online bill pay service providers. Does not include “biller direct” payments at billers’ sites. 2 Walk-in bill pay at third-party processor locations. Excludes walk-in payments at biller locations. 3 Money transfer & P2P originated in US for domestic or cross-border payments.
Year-over-year trends Cash back on debit Check payments Card payments Other interesting findings • The number of general purpose credit card transactions declined from 2006 to 2009, but increased every year except 2008 to 2009 • The number of signature debit card transactions increased every year from 2006 to 2009, but the rate of growth slowed between 2008 to 2009 • Americans received cash back on one billion debit card transactions in 2009 (1 out of every 38), for $35 billion (~5% the amount they withdrew from ATMs) • Credit union members averaged ~30% more cash than bank customers when they got cash back, and 55% of their ATM withdrawals were at “foreign” ATMs • While check writing declined, the number of remotely created checks grew to ~550 million in 2009 (2% of checks written) • Nearly half (46%) of all checks written are ineligible for conversion to ACH • 90% of credit unions and 73% of savings banks outsource check processing; this compares to only 38% for commercial banks • Businesses made 12% of all general purpose credit card transactions (2.4 billion) • Contactless payments were twice as common for debit (34 million) than for credit (17 million) but remain extremely rare (0.2% of signature debit card payments)
Payments Vehicles: Regulated vs. Unregulated • Regulation generally follows widespread adoption of payment options. Regulated payments types are generally the “old-fashioned” options: • Check • ACH • Debit Cards • Credit Cards • Emerging payment options tend to be less regulated: • Reloadable debit cards (e.g. Starbucks, iTunes) • PayPal • Ebay • Facebook • Other Internet conduits for person-to-person payments SOURCE: Federal Reserve Payments Study
What’s All the Fuss about Mobile Payments? • US payments system characterized by rapid change the past few decades, but is still changing more slowly than other industries • Smartphone technology holds promise to introduce disruptive change as to how consumers make payments, but progress has been slow in the US • Used primarily at this point as a browser, allowing access to internet-based banking and retail sites • Also used by some to pay bills (to cell phone carriers, etc) • Mobile payments at this time generally ride the ACH or card rails • Future of true mobile payments will rely on the use of near field communications or similar contactless technologies that are less prevalent in the US than in other countries SOURCE: Federal Reserve Payments Study
Contact Information Julius G. Weyman Federal Reserve Bank of Atlanta 1000 Peachtree Street NE Atlanta, GA 30309 Julius.g.weyman@atl.frb.org