Download
1 / 39
390 likes | 540 Views
Lecture 15. Knowledge engineering:. Genetic algorithms and hybrid systems Will genetic algorithms work for my problem? The travelling salesman problem Will a hybrid system work for my problem? Neuro -fuzzy decision-support systems Time-series prediction Summary.

E N D
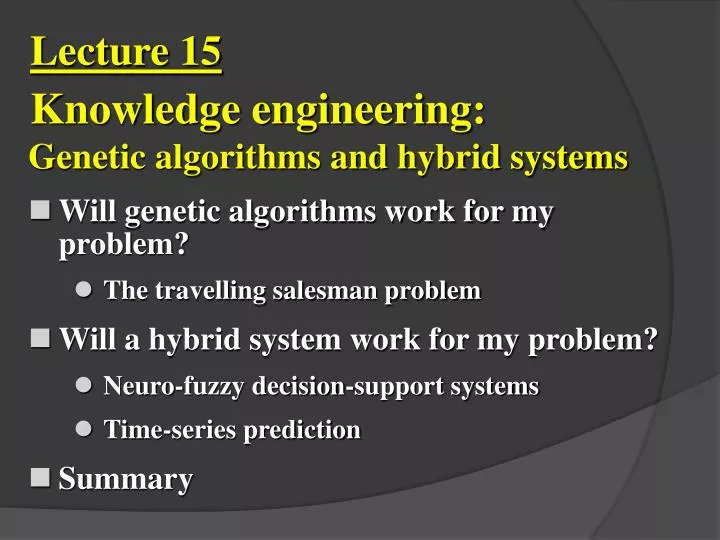
Lecture 15 Knowledge engineering: • Genetic algorithms and hybrid systems • Will genetic algorithms work for my problem? • The travelling salesman problem • Will a hybrid system work for my problem? • Neuro-fuzzy decision-support systems • Time-series prediction • Summary
Will genetic algorithms work for my problem? • Optimisation is the process of finding a better solution to a problem. • A genetic algorithm generates a population of competing candidate solutions and then causes them to evolve through the process of natural selection – poor solutions tend to die out, while better solutions survive and reproduce. By repeating this process over and over again, the genetic algorithm breeds an optimal solution.
Case study 7: The travelling salesman problem Suppose, we are going to travel by car in Western and Central Europe. We want to produce an optimal itinerary for visiting all major cities and returning home. This problem is well known as the travelling salesman problem. Given a finite number of cities, N, and the cost of travel (or the distance) between each pair of cities, we need to find the cheapest way (or the shortest route) for visiting each city exactly once and returning to the starting point.
The TSP is represented in numerous transportation and logistics applications such as • arranging routes for school buses to pick up children in a school district, • delivering meals to home-bound people, • scheduling stacker cranes in a warehouse, • planning truck routes to pick up parcel post and many others. • A classic example of the TSP is the scheduling of a machine to drill holes in a circuit board.
How does a genetic algorithm solve the travelling salesman problem? • First, we need to decide how to represent a route of • the salesman. The most natural way of representing • a route is the path representation. Each city is • given an alphabetic or numerical name, the route • through the cities is represented as a chromosome, • and appropriate genetic operators are used to create • new routes. • Suppose we have nine cities named from 1 to 9. In a chromosome, the order of the integers represents the order in which the cities will be visited by the salesman.
How does the crossover operator works? The crossover operator in its classical form cannot be directly applied to the TSP. A simple exchange of parts between two parents would produce illegal routes containing duplicates and omissions – some cities would be visited twice while some others would not be visited at all:
How does the mutation operator works? • There are two types of mutation operators: reciprocal exchange and inversion. • The reciprocal exchange operator simply swaps two randomly selected cities in the chromosome. • The inversion operator selects two random points along the chromosome string and reverses the order of the cities between these points.
How do we define a fitness function in the TSP? The fitness of each individual chromosome is determined as the reciprocal of the route length. In other words, the shorter the route, the fitter the chromosome.
Distance Performance graph and the best salesman’s route created in a population of 20 chromosomes after 100 generations
Performance graphs and the best routes created in a population of 200 chromosomes: mutation rate is 0.001
Performance graphs and the best routes created in a population of 200 chromosomes: mutation rate is 0.01
Will a hybrid system work for my problem? Solving complex real-world problems requires an application of complex intelligent systems that combine the advantages of expert systems, fuzzy logic, neural networks and evolutionary computation. Such systems can integrate human-like expertise in a specific domain with abilities to learn and adapt to a rapidly changing environment.
Case study 8: Neuro-fuzzy decision-support systems As an example, we will develop an intelligent system for diagnosing myocardial perfusion from cardiac images. Suppose, we have a set of cardiac images as well as the clinical notes and physician’s interpretation.
What are SPECT images? • Diagnosis in modern cardiac medicine is based on the analysis of SPECT (Single Proton Emission Computed Tomography) images. • By injecting a patient with radioactive tracer, two sets of SPECT images are obtained: one is taken 10 – 15 minutes after the injection when the stress is greatest (stress images), and the other is taken 2 – 5 hours after the injection (rest images). Distribution of the radioactive tracer in the cardiac muscle is proportional to the muscle’s perfusion. • A cardiologist detects abnormalities in the heart function by comparing stress and rest images.
The SPECT images are usually represented by high resolution two-dimensional black-and-white pictures with up to 256 shades of grey. Brighter patches on the image correspond to well-perfused areas of the myocardium, while darker patches may indicate the presence of an ischemia. • Unfortunately a visual inspection of the SPECT images is highly subjective; physicians’ interpretations are therefore often inconsistent and susceptible to errors.
For this study, we use 267 cardiac diagnostic cases. Each case is accompanied by two SPECT images (the stress image and the rest image), and each image is divided into 22 regions. • The region’s brightness, which in turn reflects perfusion inside this region, is expressed by an integer number between 0 and 100. • Thus, each cardiac diagnostic case is represented by 44 continuous features and one binary feature that assigns an overall diagnosis – normal or abnormal.`
The SPECT data set • The entire SPECT data set consists of 55 cases classified as normal (positive examples) and 212 cases classified as abnormal (negative examples). • The entire set is divided into training and test sets. • The training set has 40 positive and 40 negative examples. The test set is represented by 15 positive and 172 negative examples.
Can we train a back-propagation neural network to classify the SPECT images into normal and abnormal? • The number of neurons in the input layer is determined by the total number of regions in the stress and rest images. In this example, each image is divided into 22 regions, so we need 44 input neurons. • Since SPECT images are to be classified as either normal or abnormal, we use two output neurons. • A good generalisation is obtained with as little as 5 to 7 neurons in the hidden layer.
However, when we test the network on the test set, we find that the network’s performance is rather poor – about 25 percent of normal cardiac diagnostic cases are misclassified as abnormal and over 35 percent of abnormal cases are misclassified as normal; the overall diagnostic error exceeds 33 percent. • This indicates that the training set may lack some important examples (a neural network is only as good as the examples used to train it).
Can we improve the accuracy of the diagnosis? First, we need to redefine the problem. To train the network, we used the same number of positive and negative examples. Although in real clinical trials, the ratio between normal and abnormal SPECT images is very different, the misclassification of an abnormal cardiac case could lead to infinitely more serious consequences than the misclassification of a normal case. Therefore, in order to achieve a small classification error for abnormal SPECT images, we might agree to have a relatively large error for normal images.
The neural network produces two outputs. `The first output corresponds to the possibility that the SPECT image belongs to the class normal, and the second to the possibility that the image belongs to the class abnormal. If, for example, the first (normal) output is 0.92 and the second (abnormal) is 0.16, the SPECT image is classified as normal, and we can conclude that the risk of a heart attack for this case is low.
On the other hand, if the normal output is low, say 0.17, and the abnormal output is much higher, say 0.51, the SPECT image is classified as abnormal, and we can infer that the risk of a heart attack in this case is rather high. However, if the two outputs are close – say the normal output is 0.51 and the abnormal 0.49 – we cannot confidently classify the image.
Can we use fuzzy logic for decision-making in medical diagnosis? • To build a fuzzy system, we first need to determine input and output variables, define fuzzy sets and construct fuzzy rules. • For our problem, there are two inputs (NN output 1 and NN output 2) and one output (the risk of a heart attack). • The inputs are normalised to be within the range of [0, 1], and the output can vary between 0 and 100 percent.
Degree of membership Fuzzy sets of the neural network output normal
Degree of membership Fuzzy sets of the neural network output abnormal
Degree of membership Fuzzy sets of the linguistic variable Risk
Risk, % Three-dimensional plot for the fuzzy rule base
The system’s output is a crisp number that represents a patient’s risk of a heart attack. • Based on this number, a cardiologist can now classify cardiac cases with greater certainty – when the risk is quantified, a decision-maker has a much better chance of making the right decision. For instance, if the risk is low, say, smaller than 30 percent, the cardiac case can be classified as normal, but if the risk is high, say, greater than 50 percent, the case is classified as abnormal.
However, cardiac cases with the risk between 30 and 50 percent cannot be classified as either normal or abormal – rather, such cases are uncertain.
Can we classify some of the uncertain cases using the knowledge of a cardiologist? • A cardiologist knows that, in normal heart muscle, perfusion at maximum stress is usually higher than perfusion at rest: • If perfusion inside region i at stress is higher than perfusion inside the same region at rest, then the risk of a heart attack should be decreased. • If perfusion inside region i at stress is not higher than perfusion inside the same region at rest, then the risk of a heart attack should be increased.
Theseheuristics can be implemented in the diagnostic system as follows: Step 1: Present the neuro-fuzzy system with a cardiac case. Step 2: If the system’s output is less than 30, classify the presented case as normal and then stop. If the output is greater than 50, classify the case as abnormal and stop. Otherwise, go to Step 3.
Step 3: For region 1, subtract perfusion at rest from perfusion at stress. If the result is positive, decrease the current risk by multiplying its value by 0.99. Otherwise, increase the risk by multiplying its value by 1.01. Repeat this procedure for all 22 regions and then go to Step 4. Step 4: If the new risk value is less than 30, classify the case as normal; if the risk is greater than 50, classify the case asabnormal; otherwise – classify the case as uncertain.
The accuracy of diagnosis has dramatically improved – the overall diagnostic error does not exceed 5 percent, while only 3 percent of abnormal cardiac cases are misclassified as normal. • Although we have not improved the system’s performance on normal cases (over 30 percent of normal cases are still misclassified as abnormal), and up to 20 percent of the total number of cases are classified as uncertain, the neuro-fuzzy system can actually achieve even better results in classifying SPECT images than a cardiologist can.
In this example, the neuro-fuzzy system has a heterogeneous structure – the neural network and fuzzy system work as independent components (although they cooperate in solving the problem). When a new case is presented to the diagnostic system, the trained neural network determines inputs to the fuzzy system. Then the fuzzy system using predefined fuzzy sets and fuzzy rules, maps the given inputs to an output, and thereby obtains the risk of a heart attack. • Adaptive Neuro-Fuzzy Inference System (ANFIS) is a typical example of a neuro-fuzzy system with a homogeneous structure.