Download
1 / 55
580 likes | 788 Views
Three Lectures on Tropical Cyclones. Kerry Emanuel Massachusetts Institute of Technology. Spring School on Fluid Mechanics of Environmental Hazards. Lecture 3: Using Physics to Assess Tropical Cyclone Risk in a Changing Climate. Tropical Cyclones Do Respond to Climate Change!.

E N D
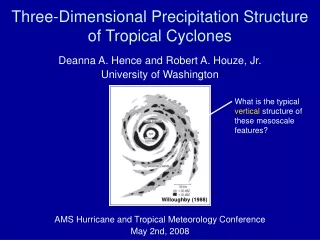
Three Lectures on Tropical Cyclones Kerry Emanuel Massachusetts Institute of Technology Spring School on Fluid Mechanics of Environmental Hazards
Lecture 3:Using Physics to Assess Tropical Cyclone Risk in a Changing Climate
Atlantic Sea Surface Temperatures and Storm Max Power Dissipation (Smoothed with a 1-3-4-3-1 filter) Years included: 1870-2006 Power Dissipation Index (PDI) Scaled Temperature Data Sources: NOAA/TPC, UKMO/HADSST1
Tropical Atlantic SST(blue), Global Mean Surface Temperature (red), Aerosol Forcing (aqua) Global mean surface temperature Tropical Atlantic sea surface temperature Sulfate aerosol radiative forcing Mann, M. E., and K. A. Emanuel, 2006. Atlantic hurricane trends linked to climate change. EOS, 87, 233-244.
Best Fit Linear Combination of Global Warming and Aerosol Forcing (red) versus Tropical Atlantic SST (blue) Tropical Atlantic sea surface temperature Global Surface T + Aerosol Forcing Mann, M. E., and K. A. Emanuel, 2006. Atlantic hurricane trends linked to climate change. EOS, 87, 233-244.
Effect of Increased Potential Intensity on Hurricane Katrina
Paleotempestology barrier beach barrier beach upland overwash fan backbarrier marsh lagoon a) barrier beach upland overwash fan backbarrier marsh lagoon b) terminal lobes flood tidal delta Source: Jeff Donnelly, WHOI Source: Jeff Donnelly, WHOI
Photograph of stalagmite ATM7 showing depth of radiometric dating samples, micromilling track across approximately annually laminated couplets, and age-depth curve. Frappier et al., Geology, 2007
Assessing Tropical Cyclone Risk: Historical Statistics Are Inadequate
U.S. Hurricane Damage, 1900-2004,Adjusted for Inflation, Wealth, and Population
Issues with Direct Use of Global Climate Models: • Today’s global models are too coarse to simulate high intensity events • Not practical to run models for long enough to generate high quality regional statistics • Embedding regional models is feasible but expensive
Our Approach: Step 1: Randomly seed ocean basins with weak (12 m/s) warm-core vortices Step 2: Determine tracks of candidate storms using a simple model that moves storms with mean background wind Step 3: Run a deterministic coupled tropical cyclone intensity model along each synthetic track, discarding all storms that fail to achieve winds of at least 17 m/s (random seeding method) Step 4: Assess risk using statistics of surviving events
Synthetic Track Generation,Using Synthetic Wind Time Series • Postulate that TCs move with vertically averaged environmental flow plus a “beta drift” correction (Beta and Advection Model, or “BAMS”) • Approximate “vertically averaged” by weighted mean of 850 and 250 hPa flow
Synthetic wind time series Monthly mean, variances and co-variances from NCEP re-analysis data Synthetic time series constrained to have the correct mean, variance, co-variances and an power series
250 hPa zonal wind modeled as Fourier series in time with random phase: where T is a time scale corresponding to the period of the lowest frequency wave in the series, N is the total number of waves retained, and is, for each n, a random number between 0 and 1.
The time series of other flow components: or where each Fi has a different random phase, and A satisfies where COV is the symmetric matrix containing the variances and covariances of the flow components.
Track: Empirically determined constants:
Run coupled deterministic model (CHIPS, Emanuel et al., 2004) along each track Use monthly mean potential intensity, ocean mixed layer depth, and sub-mixed layer thermal stratification Use shear from synthetic wind time series Initial intensity specified as Tracks terminated when v < Tropical Cyclone Intensity
6-hour zonal displacements in region bounded by 10o and 30o N latitude, and 80o and 30o W longitude, using only post-1970 hurricane data
Cumulative Distribution of Storm Lifetime Peak Wind Speed, with Sample of 2946 Synthetic Tracks
Random Seeding Method: Calibration Absolute genesis frequency calibrated to North Atlantic during the period 1980-2005
Genesis rates Western North Pacific Southern Hemisphere Eastern North Pacific North Indian Ocean Atlantic Calibrated to Atlantic
Seasonal Cycles Western North Pacific
Captures effects of regional climate phenomena (e.g. ENSO, AMM)
Year by Year Comparison with Best Track and with Knutson et al., 2007
Now Use Daily Output from IPCC Models to Derive Wind Statistics, Thermodynamic State Needed by Synthetic Track Technique
Compare two simulations each from 7 IPCC models: 1.Last 20 years of 20th century simulations2. Years 2180-2200 of IPCC Scenario A1b (CO2 stabilized at 720 ppm)
Basin-Wide Percentage Change in Power Dissipation Different Climate Models
Basin-Wide Percentage Change in Storm Frequency Different Climate Models
7 Model Consensus Change in Storm Frequency Reds: Increases Blues: Decreases