Download
1 / 40
410 likes | 547 Views
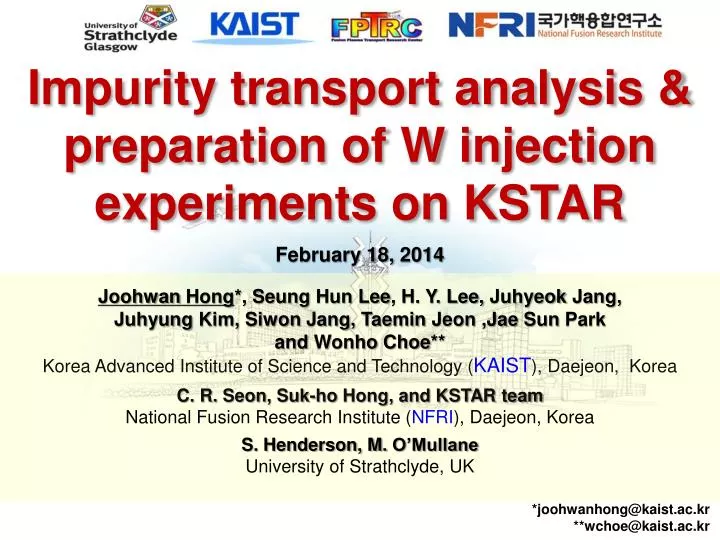
Impurity transport analysis & preparation of W injection experiments on KSTAR. February 18, 2014. Joohwan Hong *, Seung Hun Lee , H. Y. Lee, Juhyeok Jang, Juhyung Kim, Siwon Jang, Taemin Jeon ,Jae Sun Park and Wonho Choe **

E N D
Impurity transport analysis & preparation of W injection experiments on KSTAR February 18, 2014 Joohwan Hong*, Seung Hun Lee, H. Y. Lee, Juhyeok Jang, JuhyungKim, SiwonJang, TaeminJeon,Jae Sun Park and WonhoChoe** Korea Advanced Institute of Science and Technology (KAIST), Daejeon, Korea C. R. Seon, Suk-ho Hong, and KSTAR team National Fusion Research Institute (NFRI), Daejeon, Korea S. Henderson, M. O’Mullane University of Strathclyde, UK *joohwanhong@kaist.ac.kr **wchoe@kaist.ac.kr
Outline 1. Introduction - Current issues on W in tokamak plasmas 2. Current analysis tools for impurity transport study on KSTAR - ADAS-SANCO impurity code analysis - Diagnostics: SXR and VUV - Example : ECH effects on Ar transport experiments 3. Preparation of W experiments - Upgrading diagnostics : SXR and VUV - Estimation of Ar & W emission power on KSTAR for designing SXR filters 4. Summary & Discussions
Current issues on W in tokamak plasmas • Influence of W divertor on the access to the H-mode • Effect of W divertor on pedestalparameters and plasma confinement • Predicted impacts of wall and divertor material on pedestal structure • High radiation loss from W core accumulation R. Neu, ADAS Workshop, 2007, Ringberg • ITPA: “Transport of high Z impurities (including W) in the core plasma and possibilities for its control” • W injection experiments on KSTAR (superconducting machine)
Current analysis tools for impurity transport studyon KSTAR - Focused on Ar injection experiments • Transport codes (ADAS-SANCO) • Diagnostics (SXR & VUV) • Experiments & analysis results
Impurity transport analysis • SANCO (collaboration with JET) 1D radial continuity equation • - Radial particle flux : impurity ion density : particle flux via magnetic surface : source and sink (ionization & recombination fromADAS) Impurity transport modelling Experimental data Fitting • KSTAR diagnostics • Soft X-ray array • VUV spectrometer • X-ray imaging crystal spectrometer, etc… - Impurity transport code SANCO - Fitting analysis code UTC D, V determination Diffusion coefficient Convection coefficient
Soft X-ray arrays with Ar Ross filter • X-ray Ross Filter (XRF) • NaCland CaF2 • Band pass filter within the narrow region between their L III or K absorption edges KSTAR D-port 16 ch(32) 16 ch(32) 2.8-4.0 keV • Ar13+, Ar14+, Ar15+, mainly Ar16+, Ar17+
Model for Aremission in soft X-ray range (1) Calculation of local Ar radiation power (r,t) Power coeffs of RecomBination Power coeffs of Line Transition - ne from input data, nz from SANCO, PLT & PRB from ADAS (3) LoS calculation and line integration (2) Response function of Ross filter Obtaining 2.8~4 keV
ITER VUV spectrometer prototype Collaboration with ITER KO-DA (C.R. Seon) Current (15-60 nm, ~13-40 ms) (1) Measurable major line transitions He I 53.70 nm He II 25.63 nm O V : 15.61, 19.28, 21.50 nm O VI : 17.30, 18.40 nm C III : 38.62 nm C IV : 24.49, 38.41, 41.96 nm C V : 22.72, 24.87 nm Fe XV : 28.42 nm Fe XVI : 33.54, 36.08 nm Ar XIV 18.79 nm Ar XV 22.11 nm Ar XVI 35.39 nm 1ch, survey (2) Modeling of Ar line transitions VUV spectrometer on the optical table Vacuum extension - All atomic coefficients are from ADAS
Ar transport experiments with ECH • L-mode plasmas, Ip = 400 kA, Bt : 2 T • Argon gas injection through a piezo valve (trace amount of Ar : nAr/ne< 0.1%) • Different transport w/o and w/ ECH positions Feasibility of impurity control? 0.4 0.2 0.4 0.2 Ip (MA) Ip (MA) Non ECH On-axis ECH 0 1 2 3 4 0 1 2 3 4 Time (sec) Time (sec) Ar puffing 20 ms Ar puffing 20 ms On-axis ECH Ar ECH 110 GHz 300 kW Ar puffing after ECH start To see ECH effect on Ar
Less core Ar emissivity with ECH Arpuff Non-ECH VUV Ar15+ ECH r • 2.8 – 4 keV photons • Mainly Ar16+ & Ar17+emissions SXR emissivity (Non ECH) r t SXR emissivity (On-axis ECH) ECH
ADAS-SANCO analysis results L-mode Non-ECH Ch16 Convection Diffusion Ch1
Diffusion & convection with ECH L-mode On-axis ECH Ch16 Convection Diffusion Ch1
Preparation of W experiments • Upgrading current diagnostics (VUV & SXR) • Estimation of W & Ar emission power on KSTAR for designing filters of new SXR system
VUV imaging spectrometer Collaboration with ITER KO-DA (C.R. Seon) This summer(5-20 nm, 13-130 ms) Preparation in laboratory 28 ch, imaging • Active pixels: 1024 x 256 • Pixel size (W x H): 26 x 26 μm • Image area: 40 mm x 12mm of MCP adopted to CCD of 27.6 25.4 nm He II from Hollow Cathode Lamp 5~7 nm quasi-continuum peaks of W are expected ~5.5 mm Slit Imaged to CCD Slit Pattern Spacing ~ 2mm 23.4 nm 24.6 nm Clementson et al. Rev. Sci. Instrum. 81, 10E326 2010
Soft X-ray array system Current This summer 4 arrays, 256 ch 1 array, 48 ch 2 arrays, 64ch VU2 edge 16 ch(32) HU HD 16 ch(32) VD2 • 4 arrays, 256 chs • 2D Tomography • Poloidalasym. • study • < 2 cm, 2 μs • 3 filters • multi energy, • neural network • < 1.3 cm, 2 μs • Be filters (10, 50 um) • Ar Ross filters (2.8-4.0 keV Ar16+, Ar17+) • Bolometer (No filter) 2D fast MHD & transport study
Estimation of W & Ar emission power • For designing new multi-array SXR filter to measure W & Ar emission, • ADAS-SANCO simulation has been done Input EFIT Background (Te, ne) D, V (Trial value) Impurity Influx SANCO • Calculates… • nz(r, t) for every charge states z of W & Ar ADAS Calculates line emission for every line transition Te, ne nz(r, t) Line integration along LOS Final power spectrum of W & Ar
Input profiles for ADAS-SANCO Te & ne profiles of typical KSTAR L-mode and H-mode - Evaluated by ECE, TS, interferometer. (2) Influx : flow meter signal for both W & Ar (3) EFIT #7566 @ 2 s By S. Sabbagh • Recycling rate • Ar = 0.6 • W = 0.0
Input profiles for ADAS-SANCO - D & V for L mode (experimentally obtained from KSTAR #7574 Ar) - D & V for H mode (from ASDEX-U results) T. Putterich, 2005, ‘Investigations on Spectroscopic Diagnostic of High-Z Elements in Fusion Plasmas’ , PhD Thesis University Augsburg
Time evolution of line-integrated spectra (1) L-mode Ar W Brightness (W cm-2) Time (s) Photon energy (keV) (2) H-mode Ar W
W & Ar emission spectrum under KSTAR condition L-mode case H-mode case W quasi-continuum (VUV) W peaks Ar peaks (Ross filter) W peaks Ar peaks (Ross filter) W cm-2 eV-1 W cm-2 eV-1 • Continuum radiation was calculated by Zeff ~ 2.5 where with C dominant situation S. von Goeler et al., Nucl. Fusion 15, 301 (1975)
Summary • Impurity transport analysis tools on KSTAR • - ADAS-SANCO impurity transport code • - Soft X-ray array system and VUV spectrometer system • - It has well worked for KSTAR Ar injection experiments since 2012. • W injection experiment is under preparation on KSTAR • - Imaging VUV spectrometer having W quasi-continuum peaks is installed on KSTAR F-port. • - Additional SXR arrays will be installed on KSTAR D-port with Be filters for W and Ar measurement. • - ADAS database set is also ready for simulating W emissions in fusion plasmas.
Discussions (1) SXRA filter design for discriminating W and Ar emission L-mode case Be filters of 50 m 250 m W cm-2 eV-1 400 m 100 m 300 m Delgado-Aparicio et al., Nucl. Fusion 49, (2009) 085028
Discussions (1) SXRA filter design for discriminating W and Ar emission H-mode case L-mode case Be filters of 50 m 50 m 250 m 250 m W cm-2 eV-1 W cm-2 eV-1 400 m 400 m 100 m 100 m 300 m 300 m Be 50 & 250 m seem to be appropriate for L- & H- modes.
Discussions (2) Estimation of amount of W injection • Estimation conditions • - Injected # of atoms = 3.0 x 10¹⁷ for W & Ar • Find out amount of W providing similar Ar radiation level ( W/cm2 , > noise level of AXUV = 0.001 W/cm2) which was tested in previous Ar injection experiments. • Calculated Brightnessfiltered by 50 m (in W/cm2) • Brightness from Continuum = 1.10 X 10⁻¹ • Brightness from Ar emission = 1.12 X 10⁻¹ • Brightness from W emission = 5.52 X 10⁻¹ • W emission level is larger than Ar by 5 • Injected W should be reduced by 5 ? 50 m W cm-2 eV-1 • Estimated value ~ 6 X 10¹⁶ atoms (~ 18 g) Too small! • Particles should be injected more, in order to obtain the same Ar emission level, since all particles can not penetrate into LCFS.
Discussions (3) W injector for KSTAR - Gun-type injection system is under development - Please see the other presentation material for W gun… (4) Expected studies - Z-dependence study of impurity transport with double injection (Ar & W) - ECH power scan as well as other auxiliary heating (ICRH, LH) to control W & Ar impurities. - Magnetic perturbation effects on impurity transport - Asymmetric formation of impurity concentration with full 2-D tomography by new SXR system
Expected studies Z-dependence study of impurity transport - Simultaneous injection of Ar & W for the 2014 campaign JET result Giroud C. et al 13thITPA Confinement Database & Modelling Topical Group, Naka, Japan H Nordman et al, 2011 Plasma Phys. Control. Fusion • Various turbulent-based transport theories have been trying to estimate impurity transport with varying Z. Nevertheless, there is no theory explaining experimental results well. • It is required to have more experimental data to develop and revise impurity transport models.
Expected studies 2. Control impurity transport by applying auxiliary power • Controllability of Ar impurity was confirmed by ECH on KSTAR. • Applying ICRH, ECCD as well. • Effects on not only Ar but also W. • 3. Effects of RMP on impurity transport • Find out the relationship and mechanism between magnetic perturbation and impurity transport from edge (ELM) to core (impurity accumulation). • - Applying MP after injection and before injection.
Expected studies C-Mod Mo injection 4. Impurity formation of poloidal asymmetry H-mode ICRH L-mode M Reinke, et al., E1/E2 Task force meeting 2012 • Full 2-D tomography reconstruction will be available with vertical arrays • Finding poloidal asymmetry of high-Z impurities such as W • Comparing between Ar & W cases • For various plasma modes and conditions C-Mod, Mo injection
UTC-SANCO analysis UTC (Universal Transport Code) Input Geometry Background (Te, Ti, Ne) D, V (Trial value) Impurity Influx calculate 2 Ar emission diagnostic data SANCO Ar emission No Yes Set proper derivative to parameters ParameterizeCoeffs D, V or Influx Find new solution which minimize 2 Get D, V Proper? Nonlinear least square fit (Levenberg-Marquardt Method) : Error range factor : Simulated data : Measured data
Ar transport experiments with ECH • L-mode plasmas, Ip = 400 kA, Bt : 2 T • Argon gas injection through a piezo valve (trace amount of Ar : nAr/ne< 0.1%) • Different transport with varying ECH positions Feasibility of impurity control? 0.4 0.2 0.4 0.2 Ip (MA) Ip (MA) Heating position (r/a = 0, 0.16, 0.30, 0.59) No ECH On-axis ECH 0 1 2 3 4 0 1 2 3 4 Time (sec) Time (sec) Ar puffing 20 ms Ar puffing 20 ms #7574 #7566 Ar ECH 110 GHz 300 kW On-axis Ar puffing after ECH start To see ECH effect on Ar
Ar transport experiments with ECH • Argon gas injection through a piezo valve (trace amount of Ar : nAr/ne< 0.1%) • Different transport with varying ECH positions Feasibility of impurity control? • Using 110 GHz ECH system Heating positions (r/a = 0, 0.16, 0.30, 0.59) 40 cm 20 10 On-axis Ar MiJoung, EC17, May 7-10, Deurne, Netherlands, 2012 - Target: R0= 1.8 m (B0=1.964T), Tor = -5. deg. - ECH power was fixed : 350 kW - Heating position changed by tilting the lanching mirror R=1.8m N port Ip ECH Launcher y ~ 50° x Bt
Less core Ar emissivity with ECH Arpuff No-ECH VUV Ar15+ ECH r • 2.8 – 4 keV photons • Mainly Ar16+ & Ar17+emissions SXR emissivity (No ECH) r t SXR emissivity (On-axis ECH) ECH
Less core Ar emissivity with ECH r No ECH r No ECH On-axis Core ch #8 0.30,0.59 r/a = 0.16 0.16 r/a = 0.30 On-axis ECH r/a = 0.59 • Most effective (i.e., least core impurity concentration) with on-axis ECH • Less effective with ECH heating position at larger radius
2-D Reconstructed Ar emissivity • Core-focused reconstruction (Cormack algorithm) • Emissivity images of mainly Ar16+ & Ar17+ impurities No ECH On-axis ECH Z Z R R
Modification of D & V by ECH #7566: No ECH Inward #7574: On-axis ECH Outward Inward • With on-axis ECH, central (r/a = 0 ~ 0.3) diffusion and convection are increased. • For convection, the sign is reversed from – to +: Inward Outward pinch
Effect on central impurity accumulation ◈Radial distribution of total Ar density versus time by SANCO On-axis ECH (#7574) No ECH (#7566) Time Time r/a r/a Total Ar Peaked profile Hollow profile
Neoclassical contribution of Ar transport • Neoclassical calculation of D and V was done by NCLASS Exp No ECH (#7566) NCLASS 10*NCLASS On-axis ECH (#7574) Exp NCLASS 10*NCLASS • D, V by NLCASS is smaller by an order of magnitude than the experimental D, V. The impurity transport is anomalous, rather than neoclassical.
Possible mechanism of impurity pinch From quasi-linear calculation of Weiland multi-fluid model 3 impurity pinch terms[1, 2] Curvature pinch Parallel compression pinch Thermodiffusion pinch Is the outward convection of Ar due to ITG or TEM? [1] H. Nordman et al., 2011 Plasma Phys. Control. Fusion 53 105005 [2] GiroudC. et al 13thITPA Confinement Database & Modelling Topical Group, Naka, Japan