Download
1 / 34
340 likes | 472 Views
Grading of Yarn Appearance Using Image Analysis and Artificial Intelligence Technique. Dariush Semnani. HIGH LIGHT POITS. ASTM Standard Method (Section: D2255) Previous Methods for using computer vision in yarn apparent grading The aim of present research Methodology Results and discussion

E N D
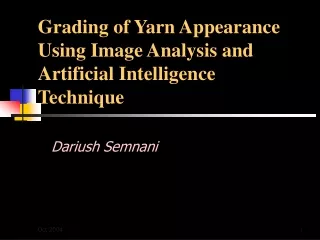
Grading of Yarn Appearance Using Image Analysis and Artificial Intelligence Technique Dariush Semnani
HIGH LIGHT POITS • ASTM Standard Method (Section: D2255) • Previous Methods for using computer vision in yarn apparent grading • The aim of present research • Methodology • Results and discussion • Conclusion
Yarn grading based on appearance Use for short staple yarns Four grade, six category of yarn count Definition of yarn grades Methodology is based on human vision Comparing with standard boards of yarn Grading is only for apparent features Not for every yarn Types It is not capable for grading of yarn in extended region Objective so non calculative Mistakes of human vision, Different judges Difficult conditions for experiment ASTM Standard Method (Section: D2255)
A Sample for Standard Boards Cat.: 16-25 TEX Grade A Grade B Grade C Grade D
Scanning of a yarn thread in different equal sections with CCD camera. Measuring of yarn diameter by image processing. Detecting of unevenness of yarn. Assign a grade to yarn based on diameter unevenness. Modeling of yarn board by sorting of scanned threads as EIB board. Lightening problems, not conformed with standard method. Not capable for detecting of yarn body region. Faults could not been classified. Assigned grade is not conformed with standard. Real board has objective appearance. Previous Methods for using computer vision in yarn apparent grading
The aim of present research • Present a new method for yarn grading based on appearance which is conformed with standard and useable for yarn boards • Useable for different yarn counts and yarn types. • Capable to classify faults based on configuration • Use image processing technique for yarn board • Development of grading region • Calculation of faults. • Definition of numerical index of grade by fuzzy logic
Methodology • Definition of apparent yarn feature based on various kinds of fault • Elimination of yarn body from picture of yarn table • Elimination of background from yarn core eliminated image • Counting and classification of faults • Grading of yarn appearance based on fault factors
STANDARD DEFINITION: nep with thickness of less than three times of yarn diameter. nep with thickness of more than three times of yarn diameter. Foreign trashes. Fettling fibers with thickness of less than three times of yarn diameter such as small bunch, slug, or slub. Fettling fibers with thickness of more than three times of yarn diameter such as big bunch, slug, or slub. Unevenness coating of yarn surface with shapes of fuzziness. Free fibers on yarn surface. These fibers are named fuzz. The fuzz should not be confused with the cover. SUMMERIZED DEFINITION: Class I: Big and entangled faults which are tightened fibers with uniform configuration. Class II: Big faults with less area in comparison with first category (Class I). Class III: Non uniform and extended faults with spread configuration. Class IV: Small spread faults such as non uniform coating fibers and short tangled hairs. Definition of apparent yarn feature based on various kinds of fault
Definition of fault classes • All of the big tightened faults such as fettling fibers, tangled fibers, big neps, big melted spots and confused helical fibers are classified in class I. These faults have big tangled area. • Other similar faults with smaller are in comparison with class I are classified in class II. • Long spread fibers as small fuzz are classified in class III. These faults are spread in area. • Small spread coating fibers and different small faults are classified in class IV.
Class III Class I Class III Class I A Sample for faults Class IV Class II
Elimination of yarn body from picture of yarn table • Scanning of board (300 DPI, Gray Scale 256, 10 by 9 inch) • More Resolution=More Processing Time & Less Res.=Less Accuracy • Converting image to binary mode (Level 110) • Elimination of yarns Cores
Why it is required to divide image to tapes l=100 α 5 degree x=8 l0 EX: 65 Tex x0
b 1 a Th c h X Finding Threshold for detecting of thread core Curve : Sorted vector of columns means for whole tapes a: Turning point Th: Threshold for thread core X : sorted vector of means Intensity: 0-1 In nominal method, point (a) is located where the difference between vector of line cb and sorted mean vector (curve) is in minimum. The height of point (a) is desired threshold value (Th).
Elimination of background from yarn core eliminated image • A small threshold for detecting of black columns in every tape = 0.1 • Procedure verifies every column with threshold for whole tapes. • After elimination of black columns length of tape is various among different tapes. • So the image of fault is a wide image with height of tape length and width of remained columns (not black).
Counting and classification of faults • Convert Fault Image to blocks vector • Finding optimum block size • Estimation of optimum values for thresholds • Classification of blocks by estimated thresholds
Image Blocking Tape length Width= remained columns Size: B by B Width= remained columns x tape length / B2
Finding Optimum Block Size • Calculation of Variance of blocks means for different block size • Optimum block size has Maximum variance of block means
TFm= Threshold of blocks means TFv= Threshold of blocks variances TFm : for bigness of fault in block TFv =for configuration of fault in block Thresholds are located in turning point of sorted vector of means and variances Turning point is calculated by numerical second order differential of vectors Sorted vector of means or deviations of blocks Tf Index of vector Estimation of Optimum Values for Threshold
Classification of blocks by estimated thresholds N1 • Class I: Condition: . Big neps, slug or slubs, and other big tangled faults are classified in this class. N2 • Class II: Condition: . Entangled faults which are smaller than faults of class I is classified in this class. • Class III: Condition: N3 . The faults which are spread in block is classified in this class. N4 Class IV: Any other blocks which are not classified in above classes . The spread small faults are located in this class
16 pixels Region between blocks The error of bad classification of faults between tow blocks • Error of the worst situation for the thinnest yarn = 0.036% • Error of the worst situation for the thickest yarn = 2.5%
Table 1: Suitable Tape and block size for core elimination of threads and classification of faults in images of standard boards
Table 2: Threshold values for classification of fault blocks in images of standard boards
Estimation of W (Classifier Ceriteria) from ANN Fuzzy Layer • 6 ANN for 6 classifier regarding to 6 Categories • ANN : Perceptron with 2 layers • Fuzzy layer only in use • Training : 10000 epok with training rate 0.1 PFF w1 PHF w2 ID w3 PLF w4 Grade PNF
Results and discussion • Cat. I, II, III: PFF weight of big faults (PFF) which is named W1, is more important in weights • Cat. IV and V: both of PFF and PHF are effective on yarn appearance, the effect of spread faults is less than tangled faults, but the difference of these faults with tangled faults is less than previous categories • Cat. VI: small and spread faults are more effect on yarn appearance in comparison with last categories, though weight of tangled faults is more than small and spread faults
Table 5: Faults weights which are calculated from standard pictures by neural nets
Table 7: Recommended grades for grading of yarns based on appearance
Conclusion • Detection and classification of faults from yarn board • Measurement of faults by image analysis and box counting method • Grading of yarn appearance from measured faults by a classifier criteria. • Estimation of classifier criteria by using ANN. • The error of grading is acceptable. • The presented method is independent to faults nature and it works based on their apparent parameters • It is possible to develop this method for grading of other types of yarn such as worsted, woolen, filament, high bulk and textured yarns