Download
1 / 43
430 likes | 604 Views
Greater Christchurch population change post EQ March Workshop. Some recent results . James Newell, MERA ( Monitoring and Evaluation Research Associates Ltd) March 18 th , 2013 Workshop. Previous MERA population monitoring and analysis outputs. November 2011 Lincoln College

E N D
Greater Christchurch population change post EQMarch Workshop Some recent results .. James Newell, MERA (Monitoring and Evaluation Research Associates Ltd) March 18th, 2013 Workshop
Previous MERA population monitoring and analysis outputs • November 2011 Lincoln College • EQ Population and Employment Effects workshop • 26th April 2012 • Public Seminar • 11th June 2012 • Seminar and workshop • 18th September 2012 • Seminar • 5th October 2012 • Population estimates report to the Christchurch Urban Development Strategy partners released • 29th January 2013 • Short lunchtime seminar
Background … • MERA report to Councils for quarters to June 2012 as a ref point to the official picture to June 2012 … • Estimated substantial additional population loss for the year to June 2012 on top of losses / unrealised migration and births gains for year to June 2011 • Made the call that a “bounce back’ or turning point in population recovery was showing most clearly in the June 2012 quarter • What is the year to June 2013 looking like it will be compared with 2012? • What are the ramifications of the latest estimates and projections? • Note that these estimates and projections are more provisional than usual – until 2013 census results avail • Thinking ahead • Integrating the evidence, estimates and projections into a narrative of the cmmties through statistics • What is the progress (process and dynamics) of the recovery of Chch and its communities
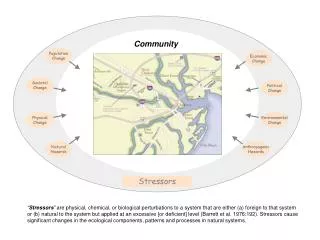
Monitoring of population change in Greater Christchurch post – EQ …? • Evidence base • Census of Population and Dwellings – last in 2006 and again in 2013 • Official statistics – External migration, births, deaths • Administrative records – education, health, electoral rolls …. • Estimates • Statistics NZ Usually Resident Population estimates • Projections / future scenarios … • Statistics NZ (pre-EQ) • UDS Modelling work post EQ
Potential sources .. • Stats NZ Official Pop estimates and projections • Stats NZ Official Statistics • NZ Census of Population and Dwellings … • Vital statistics (births and deaths) • External migration movements • Building consents • Business demographic survey • Accommodation survey … • Operational and administrative records • PHO Enrolments • LEEDS data • School / ECE / Tertiary statistics by institution • ECE enrolments … • Property records and assessments • LIS rates and property database • LIS digital cadastral database
So – what’s new? • Is the bounce back seen in the June 2012 qtr being sustained? – international migration flows shows increased momentum in population gain - post June 2012 • What is the big strategic picture = greater chch? • What is happening at some broad community level? • Snz pop est • Snz pop projns? • Jul schl rolls • Where are we in the recovery process?
International external migration flows data signals that population recovery has gathered momentum • Changes in population are the result of net effect of a range of population flows (plus effect of births and deaths) • People deciding to leave and people deciding not to arrive decrease population against what would otherwise have been expected (if EQ had not occured) • Compare expected versus actual arrivals and departures by month to Jan 2013 • Implied net effect of the EQ on expected and actual arrivals by month to Jan 2013 • Showing an increased population growth rate gain against pre-EQ expectations … catchup / recovery • Context of international, internal inter-regional, inter TLA movements, intra TLA movements, no movement…
International Migration (PLT) Actualversusexpected Permanent “Long Term” movements to Greater Chch by mth since Sept 2010 arrivals / departures..
International migration arrivals post EQ – expected vs actual - Greater Christchurch
International migration departures post EQ – expected vs actual - Greater Christchurch
International Migration (PLT) Permanent “Long Term” movements to Greater Chch EQ Effect by mth since Sept 2010 as an increase for decrease of arrivals / departures..
Back to estimates of EQ effect on population expectations for the June 2011 and 2012 years
What does these est international PLT movements effects hint at for June 2013 year? • Showing an increased population growth rate gain against pre-EQ expectations … catchup / recovery • Back of the envelope • Estimated earlier that EQ effect • Net 3,900 lower population loss from international migr flow effects …? • Data to Jan 2013 – could imply say 2,500 gain in population from effects of EQ on net international migration flows • Context of international, internal inter-regional, inter TLA movements, intra TLA movements, no movement… • Maybe GtrChch could have regained about one third of population loss post-EQ on expected if no EQ – within 2013 alone – before the rebuild process has reached full speed… • The next few months going to be determinate of the rebuild stage of the recovery…? • How will the nature of the rebuild effect (speed and length) change towards recovery completion
International Migration (PLT) Permanent “Long Term” movements to Greater Chch Est Net EQ Effect on arrivas and departures separately For specific population groups ..
Net EQ effect on Greater Chch post Sep 2010 departures by sex
Net EQ effect on Greater Chch post Sep 2010 arrivals for 20-24 yr olds
Net EQ effect for Australia movements for 15-19 yr age group
Net EQ effect for all Australia movements for 10-14 yr age group
Net EQ effect for all movements of 15-19 yr olds for Asian countries
Net EQ effect for all movements of 20-24 yr olds for Asian countries
Estimated annual migration of school age children – 2009/10, 2010/11 and 2012/13 years
Greater Christchurch : estimated net migration of school age children by age 2009/10, 2010/11, 2011/12
Christchurch City : estimated net migration of school age children by age 2009/10, 2010/11, 2011/12
Estimated changes in school age rolls by ethnicity – 2009/10, 2010/11 and 2012/13 years
2009-2012 Changes in GtrChch Lower Primary Roll by Ethnicity
Features … of change 2010-2012 in lower primary roll for Greater Christchurch • 2010/2011 reduction (inferred migration) of non-NZ European children much higher in most cases tha NZ European • More likely to be in rental housing (maybe more likely to have lost their job …) • 2011/2012 continued but reduced drop (inferred migration) of NZ European children but increase / bounce back – for most other ethnic groups • Attracted back by jobs and/or only temporarily away?
2006 Christchurch City Wards - changes in lower primary school rolls
2006 Waimakariri District Wards - changes in lower primary school rolls
2006 Selwyn District Wards - changes in lower primary school rolls
% Population est in Zoned Properties versus est % change in resident children Mar 2010 to Jul 2012 TC3 or Red land to population ratio too high? Explained by zoning changes since June 12?
% Population est in Zoned Properties versus est % change in resident children - Mar 2012 to Jul 2012
Differences between 2013 / 2006 adapted UDS urban divisions • Note that the rearrangement of 2013 area units on the 2006 pattern means that “Rural Fringe ChchNortheast” as represented on 2006 area units is grouped with “Outer surburbanChchNortheast”. • Unfortunately, this is an precisely the area which is predicted to experience the largest drop in long term population composition post EQ
Stats NZ official population estimates grouped by Chch City UDS “division” (2006/2013 best fit)
New vs Older Stats NZ medium projection by Chch City UDS “division” (2006/2013 best fit)