Download
1 / 35
350 likes | 474 Views
This document outlines effective methods for data collection in nutritional surveillance, emphasizing the importance of using suitable data sources and robust survey sampling strategies. It highlights the use of sentinel sites and the need for consistency in questionnaire design to ensure comparability across different surveys. The reporting systems must provide meaningful insights into trends rather than absolute levels, facilitating better decision-making. Sources include DHS and UNICEF modules, emphasizing the necessity of validation and follow-up in diverse settings like clinics and programs.

E N D
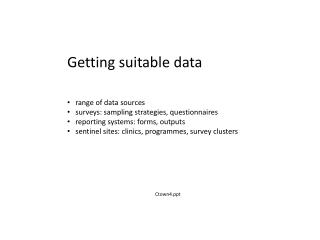
Getting suitable data • range of data sources • surveys: sampling strategies, questionnaires • reporting systems: forms, outputs • sentinel sites: clinics, programmes, survey clusters Ctown4.ppt
Surveys • sampling strategy – general (see next slide) • multi-stage, PPS, known probability of individual selection • small-scale: 30*30 (or 33*6, or …); segmentation vs spin-a-bottle • match earlier surveys • sample same population • match age-bands • keep same measures/questions (don’t change questionnaire lightly) • match seasons
DHS anthropometric questionnaire module Source: DHS Kenya report 1994
DHS feeding practices questionnaire module Source: DHS Kenya report 1994
Example of reference standards Source: WHO ‘Measuring Change in Nutritional Status’ (1983)
FSAU nutrition question-naire module (1) Source: FSAU
FSAU nutrition question-naire module(2) Source: FSAU
UNICEF model question-naire module Source: UNICEF MICS Manual (1995)
UNICEF model question-naire module Source: UNICEF MICS Manual (1995)
Reporting systems (clinics, programmes) • need to be useful at all levels • provide information on trends not levels • use all, or select by convenience • stepwise aggregation (district, province …) • preferably should have validation surveys/capacity • Sentinel sites (clinics, programmes) • same principles plus: • select sites usually for early change • focus on good data quality, training, data flow, supervision • use as signal of change in that area (but note not representative, by design) • capacity to follow up, validate, important
Sentinel sites – survey • resample same clusters at regular intervals • issue of if same hhds/kids, replacement, etc • otherwise much the same as for sentinel clinics etc • see examples of Zimbabwe, ALRMP-Kenya, Namibia plan.
Reporting form Source: FSAU
FSAU Integrated Phase Classification (IPC). Source: FSAU, Tech Manual V 1, Table 1, May 2006
FSAU IPC: General Interpretation Source: FSAU, Tech Manual V 1, Table 2, May 2006
FSAU IPC: Wasting Source: FSAU, Tech Manual V 1, Table 4, May 2006
FSAU IPC: Response framework Source: FSAU, Tech Manual V 1, Table 16, May 2006
Uganda 10% Somalia 15% Ethiopia 20% Kenya & Sudan pastoralists 25% Equivalent wasting level
1.1 Malnutrition by area Wasting was highest in Mudzi (9%). A verification exercise using clinic data was done for Mudzi and there was an indication of sharp increase in malnutrition in January 2005. Results from the 2005 vulnerability assessments done in May 2005 revealed that Mudzi district was among the districts that were food insecure. Comparison with data collected in November 2004 shows that wasting rates are higher in all the 10 sites. This is an indication of worsening of nutritional situation as it is expected that nutrition should improve during this time (March) as people start eating food from their agricultural produce. Source: Zimbabwe
= Hunger Season = Moderate = Post Rains/Harvest
Results of area-level surveys, Kenya Source: Small scale survey dataset SEMmrge10_21B.sav
IPC Survey Results, Sool Plateau, Somalia June 2006 Source: FSAU Nutrition Update September 2006
Sentinel site surveillance results, Bakool, Somalia August 2006 Source: FSAU Nutrition Update September 2006
Source: Small scale survey dataset SEMmrge10_21B.sav