Download
1 / 16
160 likes | 258 Views
Back to the Future: State of the Voluntary Carbon Markets 2011. SPONSORS. Market-wide, comprehensive survey of the OTC voluntary carbon markets Collected data from offset suppliers, registries and exchanges Agnostic on credit quality

E N D
Back to the Future: State of the Voluntary Carbon Markets 2011 SPONSORS
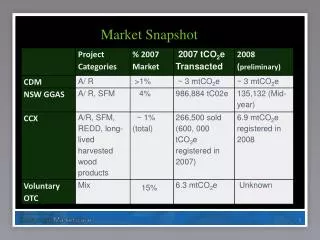
Market-wide, comprehensive survey of the OTC voluntary carbon markets Collected data from offset suppliers, registries and exchanges Agnostic on credit quality Tracks transacted credits as they pass hands in market – so transaction volume, not market size Another 261 suppliers did not transact credits in 2010, were no longer selling voluntary carbon credits or were no longer in business. This year, a record 284 respondents from 38 countries responded to our survey 2
34% of respondents from US, suppliers from developing countries doubled (2009: 29; 2010: 58) Survey Participant Location 3 Source: “State of the Voluntary Carbon Markets 2011”, Ecosystem Marketplace and Bloomberg New Energy Finance
Transaction volumes increased 34% in 2010 Historic Volume in the Voluntary Carbon Markets MtCO2e 131 130 98 68 44 28 12 13 11 7 4 Source: “State of the Voluntary Carbon Markets 2011”, Ecosystem Marketplace and Bloomberg New Energy Finance
Average OTC prices declined slightly to $6/tCO2e, 98% of value from OTC transactions Historic Value in the Voluntary Carbon Markets MtCO2e 755 424 415 348 180 110 47 45 44 27 5 Source: “State of the Voluntary Carbon Markets 2011”, Ecosystem Marketplace and Bloomberg New Energy Finance
The main goal is credit retirement, which has largely stayed level since 2007 Historic Transacted and Retired Volumes MtCO2e 6 Source: “State of the Voluntary Carbon Markets 2011”, Ecosystem Marketplace and Bloomberg New Energy Finance
Land-based credits sequester 46% of OTC market share Transaction Volume by Project Type Large Hydro 1% “other” land-based 1% 7 Source: “State of the Voluntary Carbon Markets 2011”, Ecosystem Marketplace and Bloomberg New Energy Finance
REDD methodologies closing gap on supply and demand for conservation projects Historic Transaction Volume by Forest Carbon Project Type 8 Source: “State of the Voluntary Carbon Markets 2011”, Ecosystem Marketplace and Bloomberg New Energy Finance
Latin American forestry saw unrivaled growth Transaction Volume by Location and Project Type MtCO2e 9 Source: “State of the Voluntary Carbon Markets 2011”, Ecosystem Marketplace and Bloomberg New Energy Finance
Intensified demand for future vintages Transaction Volume by Vintage MtCO2e 10 Source: “State of the Voluntary Carbon Markets 2011”, Ecosystem Marketplace and Bloomberg New Energy Finance
8 stds < 0.1% NZ PFSI 0.3% CDM 1% Plan Vivo 1% REDD stacked the odds in favor of VCS and CCB Standards Market Share by Standard SOCIALCARBON 1% 11 Source: “State of the Voluntary Carbon Markets 2011”, Ecosystem Marketplace and Bloomberg New Energy Finance
Credit prices highly stratified across (and within) standards Average Price by Standard US$/tCO2e 12 Source: “State of the Voluntary Carbon Markets 2011”, Ecosystem Marketplace and Bloomberg New Energy Finance
PoAs and grouped project guidance a prominent feature of most major certification programs Transaction Volume by PoA or Grouped Project Guidance Utilized 13 Source: “State of the Voluntary Carbon Markets 2011”, Ecosystem Marketplace and Bloomberg New Energy Finance
Registry market share mirrored standard usage, with Markit still in the lead Transaction Volume by Registry Utilized Registered vs. OTC Transacted Volumes 14 Source: “State of the Voluntary Carbon Markets 2011”, Ecosystem Marketplace and Bloomberg New Energy Finance
Mostly voluntary buyers for-profit, motivated by credit retirement – led by the EU Transaction Volume by Customer Location Transaction Volume by Type of Buyer 15 Source: “State of the Voluntary Carbon Markets 2011”, Ecosystem Marketplace and Bloomberg New Energy Finance
Voluntary carbon market participants “cautiously optimistic” about 2011 and beyond Supplier-Projected Market Growth for the Voluntary Carbon Markets MtCO2e 16 Source: “State of the Voluntary Carbon Markets 2011”, Ecosystem Marketplace and Bloomberg New Energy Finance