Download

1 / 34
340 likes | 446 Views
Using FARS Queries For Concept Papers. Objectives. By the end of this session, you will be able to: Identify data to best support a given problem Discuss various statements expressing data as a statistic Recognize a problem by analyzing data.

E N D
Objectives By the end of this session, you will be able to: • Identify data to best support a given problem • Discuss various statements expressing data as a statistic • Recognize a problem by analyzing data
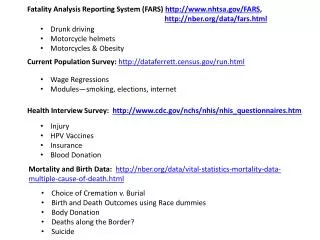
Fatality Analysis Reporting System (FARS) • Compilation of fatalities across US including: • Person types involved • Location of occurrence • Possible causes of each fatality • Pre-created tables of data • Tables created using Query
Example 1: Formulate Problem • Adults riding in vehicles without proper restraint device • Children riding in vehicles with out child restraint • Those without restraints in crashes resulting in injuries or death
Example 1: Determine Supporting Data • Identify the number of fatal injuries due to: • no restraint • improperly used restraint • List patterns common to larger groups of fatally injured, such as: • Age/race/income • Location/time of incident • Misuse of restraint
FAR Tables Find data using: • Pre-created Table • Create Table in Query
FARS Pre-created Tables Inspect tables to view different data types
FARS Tables Created by Query If data is not in pre-created table, start a query to create a table
FARS Tables Created by Query Choose a year
Example 1: FARS Table Choose an option for data sets (ex: Option 1)
Example 1: FARS Table Choose two data checkboxes (ex: “Age” and “Restraint System”)
Example 1: FARS Table • Narrow data results. Will show the two you chose, plus State will show as an option. (ex: “All” on all three)
Example 1: FARS Table • Choose which data for row and column of newly created table. (ex: chose “Age” and “Restraint System” as row and column)
Example 2: Formulate Problem • Vehicles are not yielding to pedestrians at crosswalks • Pedestrians departing bus stops are not crossing safely
Example 2: Determine Supporting Data • Identify the number of fatal injuries at: • Crosswalks • Bus stops • Other locations • List patterns common to larger groups of fatally injured, such as: • Age/race/income • Location/time of incident • Violations due to vehicle or pedestrian
Writing Statistical Statements • Must be believable/come from reliable sources • Example: 4 out of 5 dentists surveyed recommend X gum to their patients who chew gum. Who said that? • Find the trends in data to focus resources for the most impact • Persuasive language
Persuasive Words Source www.education.umd.edu
Statistical Statement Example 1 70.6% of fatalities reported were male • Where did this data come from? • How was this statistical percentage determined?
Statistical Statement Example 1 70.6% of fatalities reported were male • Document the source (ex. FARS) • Be prepared to show the math if asked 22,860 / 32,367 * 100 = 70.62749096301789
Expressing Statistical Statements A single set of data can be expressed different ways: • Most fatalities are male. • 2/3 of all fatalities are male. • Fatalities are 2 times as likely to be male. • Crashes fatalities are half as likely to be women Determine which way is most relevant to your problem (makes it sound reeaallyy bad)
Statistical Statement Example 2 4751 fatalities under 21 years of age in US 18,179 fatalities between ages 21 and 54 360+344+637+3410=4751 3,282+5,497+4,323+5,077=18,179
Find the Trend: Motorcycle Fatalities Motorcycles involved in fatal crashes per 100M VMT
Things to Avoid • Let the data speak: do not misrepresent the data. • Do not manipulate the data so that there is no way to recalculate a percentage • Avoid using “average” and “you” • Use “we and us” only when you have proper authority • Ex: somebody call 911
Other Data Sources Other sources contain crash, injury and fatality data: • Florida Crash Facts • National Center for Statistics and Analysis (NCSA)
Objectives Review You should now be able to: • Identify data to best support a given problem • Discuss various statements expressing data as a statistic • Recognize a problem by analyzing data