Download
1 / 19
190 likes | 300 Views
Statistical Performance Analysis for Scientific Applications. Fei Xing • Haihang You • Charng-Da Lu. July 15, 2014. Presentation at the XSEDE14 Conference Atlanta, GA. Running Time Analysis. Causes of slow run on supercomputer Improper memory usage Poor parallelism Too much I/O

E N D
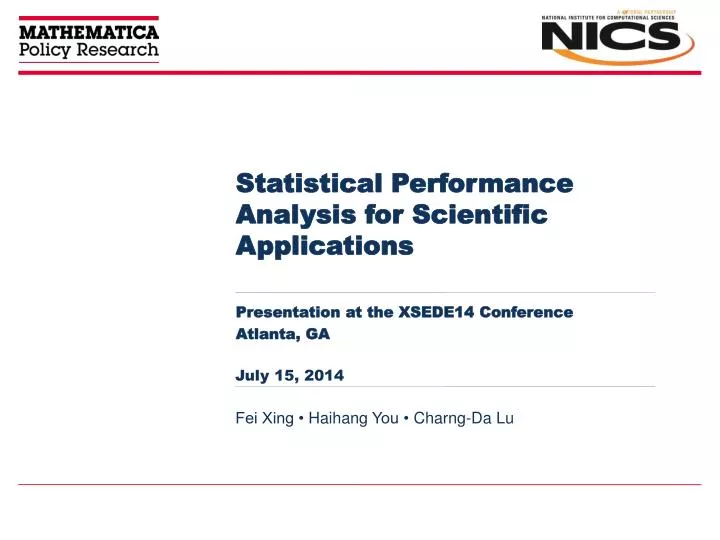
Statistical Performance Analysis for Scientific Applications Fei Xing • Haihang You • Charng-Da Lu July 15, 2014 Presentation at the XSEDE14 Conference Atlanta, GA
Running Time Analysis • Causes of slow run on supercomputer • Improper memory usage • Poor parallelism • Too much I/O • Not optimize the program efficiently • … • Examine user’s code: profiling tools • Profiling = physical exam for applications • Communication – Fast Profiling library for MPI (FPMPI) • Processor & memory – Performance Application Programming Interface (PAPI) • Overall performance & Optimization opportunity – CrayPat
Profiling Reports • Profiling tools produce comprehensive reports covering a wider spectrum of application performance • Imagine, as a scientist and supercomputer user, you see… • Question: how to make sense of these information from the report? • Meaning of the variables • Indication of the numbers TLB miss L1 Cache access MPI communication imbalance MPI calls MPI synchronization time Memory usage MPI communication time Level 1 Cache miss I/O write time MPI imbalance I/O read time More are coming!!!
Research Framework • Select an HPC benchmark to create baseline kernels • Use profiling tools to capture the peak performance • Apply statistical approach to extract synthetic features that are easy to interpret • Run real applications, and compare their performance with “role models” How about… Courtesy of C.-D. Lu
Gears for the Experiment • Benchmarks – HPC Challenge (HPCC) • Gauge supercomputers toward peak performance • 7 representative kernels: • DGEMM, FFT, HPL, Random Access, PTRANS, Latency Bandwidth, Stream • HPL is used in the TOP 500 ranking • 3 parallelism regimes • Serial / Single Processor • Embarrassingly Parallel • MPI Parallel • Profiling tools – FPMPI and PAPI • Testing environment – Kraken (Cray XT5)
HPCC Mode 1 means serial/single processor, * means embarrassingly parallel, M means MPI parallel
Training Set Design • 2,954 observations • Various kernels, wide range of matrix sizes, different compute nodes • 11 performance metrics – gathered from FPMPI and PAPI • MPI communication time, MPI synchronization time, MPI calls, total MPI bytes, memory, FLOPS, total instructions, L2 data cache access, L1 data cache access, synchronization imbalance, communication imbalance • Data preprocessing • Convert some metrics to unit-less rates: divide by wall-time • Normalization Performance Metrics Obs.
Extract Synthetic Features • Extract synthetic & accessible Performance Indices (PIs) • Solution: Variable Clustering + Principal Component Analysis (PCA) • PCA: decorrelate the data • Problem of using PCA alone: variables with small loadings may over influence the PC score • Standardization & modified PCA do not work well
Variable Clustering • Given a partition of X, Pk = (C1, …, Ck) • Centroid of cluster Ci • is the Pearson Correlation • is 1st Principle Component of Ci • Homogeneity of Ci • Quality of clustering , is • Optimal partition
Variable Clustering – Visualize This! • Optimal partition: Given a partition: P4= (C1, …, C4) Centroid of Ck: 1st PC of Ck Quality of P4: = H(C1) + H(C2) + H(C3) + H(C4)
Implementation • Theoretical optimum is computationally complex • Agglomerative hierarchical clustering • Start with the points as individual clusters • At each step, merge the closest pair of clusters until only one cluster left • Result can be visualized as a dendrogram • ClustOfVar in R
Simulation Output PI3: Computation + + + + + + + + 0.53* 0.52* 0.46* 0.49* 1.00* -0.07* -0.15* 0.81* -0.30* -0.14* 0.45* PI2: Memory PI1: Communication
PI1 vs PI2 • 2 distinct strata on memory • Upper – multiple node runs, need extra memory buffers • Lower – single node runs, shared memory • High PI2 for HPL PI2. Memory PI1. Communication
PI1 vs PI3 • Similar PI3 pattern for HPL and DGEMM • Computation intensive • HPL utilize DGEMM routine extensively • Similar all PIs for stream & random access PI3. Computation PI1. Communication
Applications Voronoi Diagram • 9 real-world scientific applications in weather forecasting, molecular dynamics and quantum physics • Amber: molecular dynamics • ExaML: molecular sequencing • GADGET: cosmology • Gromacs: molecular dynamics • HOMME: climate modeling • LAMMPS: molecular dynamics • MILC: quantum chromodynamics • NAMD: molecular dynamics • WRF: weather research PI3. Computation PI1. Communication
Conclusion and Future Work We have • Proposed a statistical approach to give users a better insights into massive performance datasets; • Created a performance scoring system using 3 PIs to capture high-dimensional performance space; • Gave user accessible performance implications and improvement hints. We will • Test the method on other machine and systems; • Define and develop a set of baseline kernels that better represent HPC workloads; • Construct a user-friendly system incorporating statistical techniques to drive more advanced performance analysis for non-experts.
Thanks for your attention! Questions?