Download

1 / 53
530 likes | 786 Views
Dual Beta Model. Ho Ken Jom, Li Wenru, Zhang Jian Department of Mathematics, NUS, 14 March 2011. The Reference Paper. Does beta react to market conditions? Estimates ‘bull’ & ‘bear’ betas using a nonlinear market model with an endogenous threshold parameter

E N D
Dual Beta Model Ho Ken Jom, Li Wenru, Zhang Jian Department of Mathematics, NUS, 14 March 2011
The Reference Paper Does beta react to market conditions? Estimates ‘bull’ & ‘bear’ betas using a nonlinear market model with an endogenous threshold parameter -by George Woodward; Heather M.Anderson, Quantitative Finance, 25 March 2009
Outline of The Presentation • The Model • Strategy • Back Testing
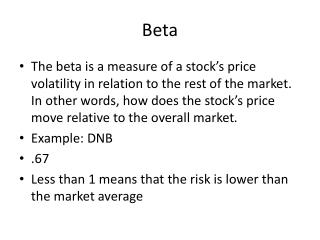
Definition of “Bull” and “Bear” market Compare market index to a critical threshold value How to differentiate market states Trend-based scheme
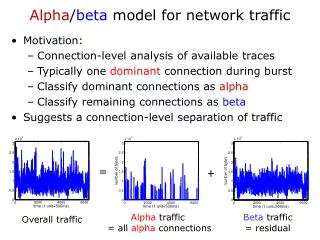
Market indicator- transition variable R* • R*= 12 month moving average of logarithmic returns • smoother • noise not “useful” Figure 1: Return on the market index Figure 2, The transition variable (R*) Jump in and out of market phases rapidly Much smoother path
Models Dual-beta market model: : Market state indicator. critical threshold value for each industry Bear state: Bull state:
Models Logistic Smooth Transition Market Model F is the logistic smooth transition function, : smoothness parameter When is large and negative When is large and positive
Data • 24 industry groupings within the Australian Stock Exchange • Observations are monthly • Return series are calculated as the difference of the logarithms of prices.
Estimation—LSTM model LSTM models: • 15 industries: significant at 5% • 6 industries: significant at 10% • 11: negative • 10: positive • “Smooth” transition • estimate LSTM
Estimation—DBM model • Parameter estimates are almost identical
Estimation—DBM model LSTM model • DBM fits the data well(R2) • Stocks spend more time in ‘bull’-market • ESS is not affected
Summary • ‘Bull’ and ‘bear’ betas are significantly different for most industries • Transition between states is abrupt, supporting a dual-beta market modeling framework • For many industries, stocks spend more time in ‘bull’-market than ‘bear’-market states. • The risk associated with ‘bull’ states is not always smaller than the risk in ‘bear’ market states.
Strategies for Dual Beta Market Model • Terms used • Model Calibration • Theory behind the strategy • Calculate the “fair” return of index • Search mispriced spots and trade • The shortage of the strategy
Terms • Rm, Ri: Market/Index return • βu,βd: Beta in “up”/”down” state • α: Alpha • c: Threshold (defined on Rm) • Tu,Td: Upper and lower thresholds (for trading) • RMA: Rolling moving average • ε: the deviation from fair rate
Bull & Bear • Paper suggests dual beta model • Differing betas for different market states • Relatively sudden transition • Suggests a market inefficiency • Use a 12-month MA to determine state • Market state only changes a few times (2-5 years)
Up and Down • Attempts with a 12-month MA yielded losses • Not suitable for forecasting, trading on • Long-term/”slow” changes not useful • Trials with daily market data (Rm) successful • State can (and does) change from day to day • Investor sentiment • Smaller, but still significant changes
Model • For a given c (Threshold value) partition data into “up”/”down” sets • Fit a dual beta (single alpha model) • Choose the c, α, βu,βd that provide the best fit (R2) • Look for significant change in beta
Model Calibration • Calibration for single beta model (SBM) • Use the α of SBM to initiate a search for parameters of dual beta single alpha model(DBSAM) • The DBSAM should have a higher R-square as expected • Trade on pairs of high R-square
Data Process • For a given set of estimated model parameters • Calculate Rm, compare with c to obtain state • Calculate Ri, compare with (α + βRm) • Check where difference lies w.r.t thresholds
Fair Rate (Model Predicted rate) • For a given set of estimated model parameters • Calculate Rm, compare with c to obtain state • Calculate the fair rate of index return if(Rm<C) α + βd Rm if(Rm>C) α + βu Rm • The deviation is given as ε = Ri-(α+ βu Rm)
Thresholds • Above +Tu: over-performing or “cheap” • Buy • Below –Tu: under-performing or “expensive” • (Short) Sell • Between ±Td: No significant difference (noise) • Close out positions
Thresholds • Higher thresholds are more conservative • Buy only during bigger differences • Close out positions more quickly • Thresholds estimated by backtesting • Conservative thresholds give less gains/losses • Important to determine the best threshold
Strategy • Impose a position limit +1, -1 • For p=0: if(ε >Tu), p = 1; else p =-1 • For p=1: if(abs(ε) <Td), p = 0, update P&L; else if(ε <-Tu), p = -1, update P&L • For p=-1: if(abs(ε) <Td), p = 0, update P&L; else if(ε >Tu), p = 1, update P&L
The Shortage of The Strategy • Vulnerable to Systematical Risk (suppose p=1 but the market drops during holding period, or p=-1, but the market rise) • Does not consider transaction cost • Solution: impose further restrictions -impose positive condition for each cycle of trading -when return is very high, don’t short, and vice versa; do not hold for a long time for a long position, etc…
Back Testing • Setup • Stationary Trading • Dynamical Trading • Stress Testing • Future Works • Conclusion
Setup • Data Selection • Using Spot rate of return instead of RMA • Calibrating dual beta single alpha model (DBSAM) • Parameterization of the strategy • Which return to use? • The state transition probability
Data Selection • Market variable: S&P 500(^GSPC) • Target indices scanned: NYSE Composite (^NYA) NASDAQ Composite ( ^IXIC) Vanguard Index Trust 500 Index (VFINX) PHLX OIL SERVICE SECTOR INDEX ( ^OSX) Bank of America (BAC) • Period: 01/01/2009~04/03/2011 (546 days), by YahooEOD Add some plots to show the betas here
R-Square for the First 294 Days *Sector index and single stock has low R-square thus trade S&P500 & NYA
Using Spot Rate of return RMA data yields a bad fitting, and even fails itself, so chose spot rate return of S&P500 for trading
Calibration of DBSAM • First conduct an SBM OLS on the whole 294 days data • Then partition the data to lower wing and upper wing with different candidate threshold values • Then for each partition, generate α-grid (see below), search for α and the associate βd & βu such that the composite R-square is maximized • In my program, s = 0.01, i = -25, …,25, but is still expensive in computing
OSX ~ S&P500 SBM Fitting R2 = 0.69, Beta = 1.46, ALPHA = 0.175
OSX~NYA DBSAM Fitting R2 = 0.76, Beta Lower = 1.56, Beta Upper = 1.44, ALPHA = 0.415
Parameterization of The Strategy nTrade number of trading days in US, set as 252 ND number of days in data, in our case this is 546 NRD number of days for regression NRD = 546-NBT NBT number of days for back-testing TH the threshold weight to partition the market E the average modeling error Tu the threshold to trigger a position in scales of E Td threshold to close a position in scales of E Limit position limit, set as +1, -1 S the resolution for search for alpha, fixed as 0.01 FEE fees, set as zero for the time-being
Which Return to use? • Program uses daily holding period return • Test shows log return performs better • However, for the purpose of consistency, I keep using daily holding return
State Transition Probability(1) Define modeling error at t, t=0,1,..,N as Et. Assume : For all positive E’s, sum over both sides Similarly, we have Once we know r, we can estimate the volatility using
State Transition Probability(2) Now, suppose the initial error is Et which is less than Td. After 1 time unit, the error distribution is given as Then the probability that a long position will be triggered is Eventually this will enable us to estimate the holding period.
Stationary Trading The model is calibrated using the first NRD days data, and back-tested against the left NBT days data, assuming the model is stationary • Search optimal Tu(trigger threshold) • Search optimal Td (closing threshold) • Search optimal TH (weighting threshold) • Different NBT (number of back-testing days) • High Frequency Trading
Optimal Tu *Setting: NBT = 126, Td = 0.1, TH = 0.2
Optimal Td *Setting: NBT = 126, Tu = 5, TH = 0.2
Optimal TH *Setting: NBT = 126, Td = 0.5, Tu = 5
High Frequency Trading with Different NBT *It can be observed that (i) DBSAM is better (ii) return increases with NBT (Setting: Td = 1, Tu = 2, TH = 0.3)
Dynamic Trading • The issue of computing time -It takes 50s for Java to search the grid, for 252 days, weekly update, need 42m on Dell OptiFlex755 • Using C & CUDA -Reduce to 7m (on Nvidia GTX580) • Some results
Possible Reason for Under-Performance My own OLS algorithm for regression passing through the origin (consistent with matlab) yield slightly different parameters from AlgoQuant.
Stress Testing (stationary): against 2007~2009 Crisis • Case I: Regression before crisis and back testing in crisis(1 Jan 2007~6 Mar 2009) • Case II: Both in crisis (3 Jan 2008~6 March 2010) • Case III: Regression in crisis and back testing out crisis? But no such case!