Download
1 / 57
570 likes | 678 Views
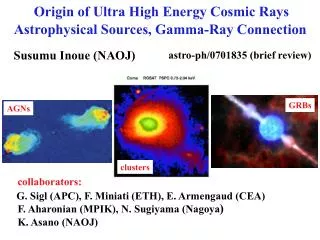
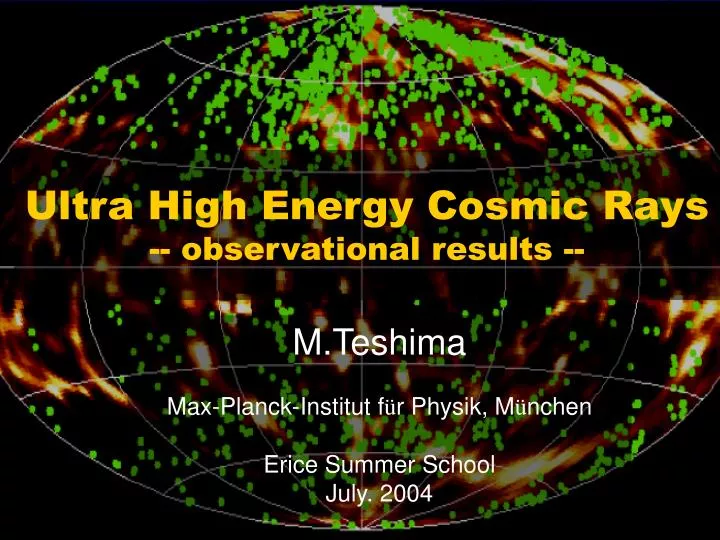
Ultra High Energy Cosmic Rays -- observational results --. M.Teshima Max-Planck-Institut f ü r Physik, M ü nchen Erice Summer School July. 2004. Discovery of Cosmic Rays. Victor Hess 1912. John Linsley at Volcano Ranch (~1960). First discovery of super-GZK events. GZK mechanism. N. P.

E N D
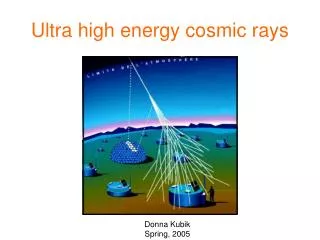
Ultra High Energy Cosmic Rays-- observational results -- M.Teshima Max-Planck-Institut für Physik, München Erice Summer School July. 2004
Discovery of Cosmic Rays Victor Hess 1912
John Linsley at Volcano Ranch (~1960) First discovery of super-GZK events
GZK mechanism N P Δ Super GZK part. ~1/km2 century π γ3K Cosmic Ray Energy Spectrum AGASA Energy Spectrum
Pair creation GZK Background Radiations in the universe Cosmic Rays and Neutrino
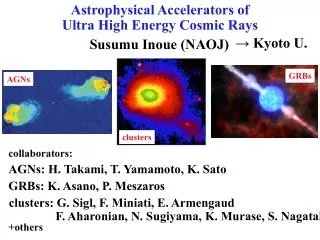
Candidates for EHE C.R. accelerator A.G.N. Pulsar SNR GRB Radio Galaxy Lobe
Synchrotron radiation GZK limit Hidden HILLAS PLOT II Ann. Rev. Astron. Astrophys. 1984, 22; p425-444
Cosmic Ray Propagation in our Galaxy • Deflection angle ~ 1 degree at 1020eV • Astronomy by hadronic particles?
AGASAAkeno Giant Air Shower Array 111 Electron Det. 27 Muon Det. 0 4km
HiRes Experiment Air Fluorescence detector
HiRes Experiment Air Fluorescence technique Measure Shower Development in the atmosphere Essentially Carolimetric measurement
Detector Calibration in AGASA experiment Detector Position Gain as a function of time (11years data) Survey from Airplane ΔX,ΔY=0.1m, ΔZ=0.3m Cable delay (optic fiber cable) Accuracy of 100ps by measuring the round trip time in each run Linearity as a function of time (11years data) Detector Gain by muons in each run
Detector Response vertical θ = 60deg Detector Simulation (GEANT) Detector Housing (Fe 0.4mm) Detector Box (Fe 1.6mm) Scintillator (50mm) Earth (Backscattering) Energy spectra of shower particles
EnergyDetermination • Local density at 600m • Good energy estimator by M.Hillas E=2.13x10²⁰eV, E >= 1.6x10²⁰eV
Third Highest event 97/03/30 150EeV 40 detecters were hit
S(600) vs Nch Attenuation curve 1018eV Proton Atmospheric depth
S600 Attenuation curve 0-60° 20.0 19.5 19.0 18.5 18.0 0-45° Atmospheric depth
The Conversion from S600 to Energy Muon/Neutrino Ele. Mag
Proton S600 Intrinsic fluctuation for proton and iron Iron
Major Systematics in AGASAastro-ph/0209422 • Detector • Detector Absolute gain ± 0.7% • Detector Linearity ± 7% • Detector response(box, housing) ± 5% • Energy Estimator S(600) • Interaction model, P/Fe, Height ±15% • Air shower phenomenology • Lateral distribution function ± 7% • S(600) attenuation ± 5% • Shower front structure ± 5% • Delayed particle(neutron) ± 5% • Total± 18%
25% 30% Energy Resolution mainly due to measurement errors (particle density measurement and core location determination)not due to shower fluctuation
Energy Spectrum by AGASA (θ<45) 11 obs. / 1.8 exp. 4.2σ 5.1 x 10¹⁶ m2 s sr
The Energy spectrum by AGASA Red: well inside the array (Cut the event near the boundary of array)
Recent spectra (AGASA vs. HiRes@Tsukuba ICRC) vs. HiRes-II vs. HiRes-I • ~2.5 sigma discrepancy between AGASA & HiRes • Energy scale difference by 25% vs. HiRes-stereo
20% energy variation AGASA vs HiRes by Douglas Bergman
Statistics ~2.4 σ HiRes AGASA ~2.3 σ ~4.2σ ~ 0σ ~ 0 σ Extended spectrum Super-GZK GZK-Hypothesis
40% uncertainty Air Fluorescence yield Measurement Impact parameter 1. Bunner 2. Kakimoto et al 3. Nagano et al Rayleigh Scattering ∝λ‐4
Possible Systematics in HiResMost of them are energy dependent Air Fluorescence yield • Total yield is known with 10~20% accuracy • Yields of individual lines are not known well • Rayleigh Scattering effect (∝1/λ4) Light transmission in air • Mie Scattering • Horizontal attenuation, Scale Height, Wind velocity, Temperature single model represents whole data • Horizontal 12km (1999) 25km (2001) Cherenkov light subtraction Bias by Narrow FOV in elevation angle Errors in Mono analysis • Aperture estimation (Narrow F.O.V.) • Chemical composition / Interaction dependent
Arrival Direction Distribution >4x10¹⁹eVzenith angle <50deg. • Isotropic in large scale Extra-Galactic • But, Clusters in small scale (Δθ<2.5deg) • 1triplet and 6 doublets (2.0 doublets are expected from random) • One doublet triplet(>3.9x10¹⁹eV) and a new doublet(<2.6deg)
Space Angle Distribution Log E>19.0 Log E>19.2 Log E>19.4 Log E>19.6
Energy spectrum of Cluster events∝E -1.8+-0.3 Cluster Component
2D-Correlation Map in (ΔlII ,ΔbII ) Log E >19.0eV, 3. 4σ Log E >19.2eV, 3. 0σ ΔbII ΔlII Log E >19.4eV, 2.0σ Log E >19.6eV, 4.4σ
Cosmic Ray propagation in Galactic Magnetic Field ΔbII ΔlII Aperture By Stanev
Full sky map of deflection angles By K.Dolag, D.Grasso, V.Springel, and I.Tkachev
Expected Auto correlationYoshiguchi et al. 2004 Number density of sources ~10-5 Mpc-3