Download
1 / 41
410 likes | 543 Views
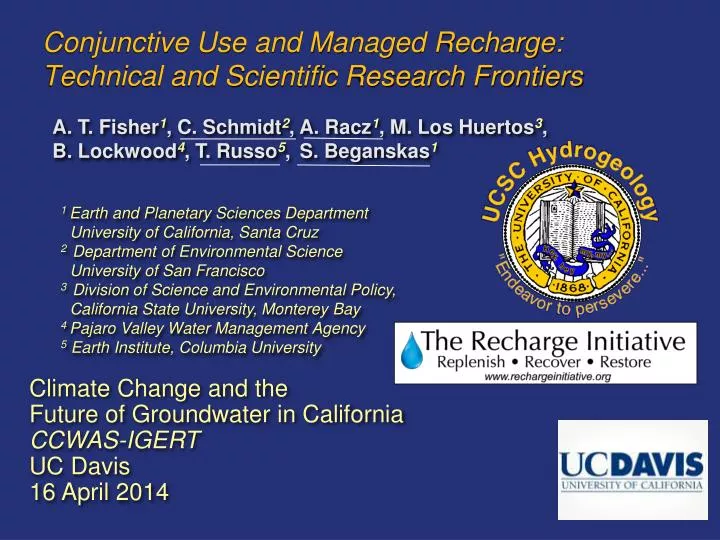
Conjunctive Use and Managed Recharge: Technical and Scientific Research Frontiers. A. T. Fisher 1 , C. Schmidt 2 , A. Racz 1 , M . Los Huertos 3 , B. Lockwood 4 , T. Russo 5 , S. Beganskas 1. 1 Earth and Planetary Sciences Department University of California, Santa Cruz

E N D
Conjunctive Use and Managed Recharge:Technical and Scientific Research Frontiers A. T. Fisher1, C. Schmidt2, A. Racz1, M. Los Huertos3, B. Lockwood4, T. Russo5, S. Beganskas1 1 Earth and Planetary Sciences Department University of California, Santa Cruz 2 Department of Environmental Science University of San Francisco 3 Division of Science and Environmental Policy, California State University, Monterey Bay 4 Pajaro Valley Water Management Agency 5 Earth Institute, Columbia University Climate Change and the Future of Groundwater in California CCWAS-IGERT UC Davis 16 April 2014
Groundwater recharge: essential for sustaining water resources, a hydrologic research frontier • Groundwater recharge is: • Naturally occurring process • Primary input to most aquifers • Most difficult component of hydrologic cycle to measure • Managed Aquifer Recharge (MAR) is: • Increasingly important for groundwater management in CA • Feasible in many groundwater basins • Dependent on availability of appropriate supplies • Method to improve both water supply and water quality • A window into cryptic, subsurface processes (natural laboratory)
Many forms of groundwater recharge (natural, managed) Regional Flow • Different recharge systems require specific conditions, design, operations – "all recharge is local"
Some Questions in Planning and Operating Managed Recharge Projects • Where are the best locations to enhance recharge? • What will be the source of the water? • What operational plan will provide the greatest benefit? • How does recharge vary in space and time? • What controls variability in recharge rates? • What maintenance will be required for operating systems? • What will be the impacts on water quality? • What is the fate of recharged groundwater? • What is the value of recharged water? • Can recharge be monetized/incentivized? • Who receives the benefits?
Pajaro River and Pajaro Valley basins PR basin: 3400 km2, multiple counties, tributaries, creeks PV land use: urban, agricultural, rural Surface water systems impaired by elevated nutrients and sediment (EPA) Primary fresh water resource is groundwater PV GW extraction exceeds the sustainable yield of the basin
Overdraft is a regional challenge Pumping: ~55k ac-ft/yr City of Watsonville: ~7k ac-ft/yr Sustainable yield: 40k–45k (?) ac-ft/yr (depends on pumping distribution, time horizon, natural variability) Overdraft: 10k–15k (?) ac-ft/yr (depends on definition, annual conditions, definitely large) 200 to 350 ft/yr map from PVWMA, 2012
Weighting Surface and Subsurface Data Russo et al., 2014 – GW, in press
MAP of MAR Suitability Harkin Slough MAR project • Total area: 56,000 acres • Upper quartile of SI (30-40): 7,200 acres (13%) Harkins Slough MAR project (SI = 32) High MAR suitability Low Russo et al., 2014
Modeling MAR Influence Coastal MAR High MAR suitability Russo et al., 2014 Variations in groundwater levels resulting from: • Ten MAR projects, distributed randomly • 4,000 ac-ft/yr additional MAR throughout basin • 34 years of model operation (compare to basecase) Coastal MAR gives faster benefit, at cost of "recovery efficiency"
Testing Field Conditions for MAR Suitability Test sites HS
Installing Infiltration Testing System 2. Build liner 1. Dig pit 4. Fully instrumented 3. Install thermal probes
Infiltration Test Data: Stage versus time 10 days Stage (ft) Stage (ft) 36 fill-empty cycles 24 hours
Infiltration Test Data: Stage versus time All data: Final six minutes: Long term infiltration capacity 20 ft/day
∆ Thermal Probes Used to Determine Vertical Infiltration Rate Pit Shallow sediments ∆z • Autonomous thermal probes in tubes at base of pit • Diel temperature changes carried downward by infiltrating water ∆= Phase shift Ar = Ad/As = Amplitude ratio Racz et al., 2011
Infiltration Test Data: Temperature versus time 14 days Shallow probe Deep probe
Infiltration Test Data: Total and vertical infiltration All data: Final six minutes: Total infiltration : vertical infiltration = 10 : 1 Thermal data, ICVertical= 2 – 3 ft/day
Harkins Slough MAR project • Up to 2000 ac-ft of water may be diverted from Harkins Slough to 7-acre recharge pond, infiltrated into shallow aquifer • Water later recovered, blended with recycled water and other groundwater, distributed using coastal pipeline
view Sampling and instrumentation • Soil borings (grain size, carbon) • Thermal and pressure probes (flow rates, soil properties) • Piezometers and lysimeters (infiltration-fluid sampling) • Monitoring wells (water levels, aquifer water sampling) ~7 acres
Spatially variable and dynamic infiltration Infiltration rate 15 January 2008 MAR day 5 modified from Racz et al. (2011)
Spatially variable and dynamic infiltration Infiltration rate 30 January 2008 MAR day 20 modified from Racz et al. (2011)
Spatially variable and dynamic infiltration Infiltration rate 14 February 2008 MAR day 35 modified from Racz et al. (2011)
Spatially variable and dynamic infiltration Infiltration rate 29 February 2008 MAR day 50 modified from Racz et al. (2011)
Spatially variable and dynamic infiltration Infiltration rate 14 March 2008 MAR day 65 modified from Racz et al. (2011)
Spatially variable and dynamic infiltration Infiltration rate 29 March 2008 MAR day 80 modified from Racz et al. (2011)
Fluid sampling to assess changes in water quality as a function of infiltration rate, other parameters Fluid sampling lines Piezometers for fluid sampling Thermal monitoring tube -0.5 m -1.0 m 24–36 sample locations C. Schmidt, USF
Nitrate concentration is reduced during infiltration Profile 1 2 3 4 [NO3-] in pond Nitrate (μM) Days of MAR, WY 2008 Schmidt et al. (2011a)
Nitrate load is reduced as well… Pond Profile 1 Profile 2 Profile 3 Profile 4 Load Reduction Nitrate Load (kg N) Load reduction of ~50%, (600 kg of nitrate-N) Days of MAR, WY 2008 …as a function of infiltration rate Schmidt et al. (2011a)
Thank you! Questions? Reprints available: afisher@ucsc.edu
Some forms of groundwater recharge and management Groundwater recharge Natural recharge Managed recharge Regional (precipitation) Streambed Irrigation Surface recharge (MAR) Well recharge • Identify locations and quantify • Protect and enhance • Confined aquifer wells • Water table wells • Vadose zone wells • Stream bank filtration • Spreading basin/trench Single purpose (injection) or dual purpose (ASR) • In-lieu recharge • conjunctive use
Central coastal CA is highly dependent on GW This provides challenges and opportunities for the Pajaro Valley GW = 83% of usage DWR, Bulletin 160, 1998
CA spendsa lot of money,time, and energymoving wateracross the state. Central coast hydrologic region is "lightly" involved in water transfers
DWR Water Plan Update 160-98:status and projections for future needs All units are Maf Population (1995): 32.1 M Population (2020): 47.5 M (+48%) estimated
DWR Water Plan Update 160-09: Now includes environmental flows… Much of this is overdraft All units are Maf • Climate change mentioned in 2005 update
Future water “supply” options GW Bulletin 160, 2005
San Francisco Bay Area Precipitation stations 1890–2010 Years of record 120 15 Latitude (°N) San Francisco Stanford 50 km Longitude (°W) modified from Russo et al.(2013)
Compare 1890-1955 to 1956-2010: Storm intensity has increased… 10 d 3 d 1 d 50 12 …likely reducing groundwater recharge modified from Russo et al.(2013)
Groundwater overdraft leads to numerous undesirable conditions and processes… Overdraft can cause: • seawater intrusion • subsidence • permanent loss of storage • loss of stream or wetland flow • development of dry gaps • damage to riparian habitat • lowering of water quality
Some advantages of enhancing groundwater storage/conjunctive use • plenty of available space (another 5+ Mafeach year in CA!) • less evaporative loss than surface storage • may improve water quality (surface/ground) • can be less impact on surface infrastructure • can use less energy for storage and conveyance • can use surface storage/conveyance multiple times • can be cheaper than alternatives • can respond to irregular supply, changing climate conditions • can allow banking (increases flexibility) • can be combined with LID, storm-water retention, other goals • can improve aquatic habitat (lakes, streams, wetlands) • can reduce seawater intrusion, other impacts from overdraft • local solution to a local problem (can be politically viable)
Some challenges to enhancing groundwater storage/conjunctive use • can require specialized infrastructure • requires energy for construction and operation • groundwater does not sit still, recovery <100% • managed recharge comingles with ambient groundwater • potential to harm water quality • not all basins/partners have access to both suitable aquifers • can lead to problems with infiltration, drainage • stored water can't be seen • water rights may be unclear; legal challenges likely • permitting required for use of some water sources • solving water supply challenges may promote growth • local control can become regional control • who goes first?