Download
1 / 10
100 likes | 240 Views
Präsentation der Software FlexPDE5. Seminar Grundwasserwirtschaft Betreuer: Prof. J. Fürst Präsentation von: Georg Kyriazis Matr. Nummer: h0540528 Studiengang: 431 & 432. Definitionen.

E N D
Präsentation der Software FlexPDE5 Seminar Grundwasserwirtschaft Betreuer: Prof. J. Fürst Präsentation von: Georg Kyriazis Matr. Nummer: h0540528 Studiengang: 431 & 432
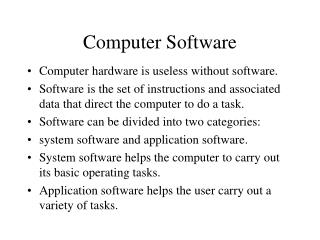
Definitionen • Einfache Beschreibung: FlexPDE ist ein Softwaresystem zum numerischen Lösen partieller Differentialgleichungen (PDE). • Komplexe Beschreibung: FlexPDE ist ein scriptbasierter Finite Elemente (FE) Generator und numerischer Solver, sowie auch eine Problemlösungs- Software- Umgebung. Seminar Grundwasserwirtschaft WS2007/08 FlexPDE5 Kyriazis
D.h FlexPDE basiert auf das User- generierte Script, wandelt das System der partiellen Differentialgleichungen (PDE) in einem FE Model, löst das System und präsentiert graphisch und tabellarisch die Ergebnisse. • Als Software – Umgebung stellt alle Tools bereit: Einen Editor zum vorbereiten der Scripts, einen Maschengenerator zum generieren der FE-Maschen, einen FE Solver zum Lösen des Systems und ein graphisches System zum ploten der Ergebnissen. Seminar Grundwasserwirtschaft WS2007/08 FlexPDE5 Kyriazis
Anwendungsbereiche • Fast alle physikalische Prozesse und Probleme können mit partiellen Differentialgleichungen beschrieben werden. Praktisch könnte FlexPDE überall benutzt werden, z.B: Seminar Grundwasserwirtschaft WS2007/08 FlexPDE5 Kyriazis
Vom PDE Solutions Website: (http://www.pdesolutions.com/index.html) Seminar Grundwasserwirtschaft WS2007/08 FlexPDE5 Kyriazis
Formulierung des mathematischen Modells • FlexPDE „braucht“ zwei primäre Inputs: 1. Welche die Variablen sind, die man analysieren möchte. 2. Welche ist die partielle Differentialgleichung die den Prozess – die Variablen beschreibt. Seminar Grundwasserwirtschaft WS2007/08 FlexPDE5 Kyriazis
2 Beispiele mit Brunnen: • Fertiges Beispiel: WATER.PDE (auch als PDF-File – Anhang) • Selbstgemachtes Beispiel mit Fluss, verdichtete Stelle und 1 oder 2 Brunnen, basierend auf das fertige Beispiel (Einschränkungen bei der Studenten - Version). Seminar Grundwasserwirtschaft WS2007/08 FlexPDE5 Kyriazis
{ WATER.PDE } { This problem shows the flow of water to two wells, through soil regions of differing porosity. It also displays the ability of FlexPDE to grid features of widely varying size. } title 'Groundwater flow to two wells' definitions k { no value is required, as long as it appears later } s = 0 { no volumetric source } k1 = 0.1 { high porosity value } k2 = 1.0e-7 { low porosity value } sx1 = 0.7 sy1 = 0.4 { well 1 location } sx2 = 0.5 sy2 = 0.2 { well 2 location } srad = 0.001 { well radius = one thousandth of domain size } w = 0.05 { a zoom window size } px = 0.4 py = 0.4 { percolation pond center } pr = 0.025 { percolation pond radius } ps = 1e-4 { percolation rate } Variables h equations div(k*grad(h)) + s = 0 boundaries Region 1 { The domain boundary, held at constant pressure head } k=k1 start(0,0) value(h)=0 line to (0.25,-0.1) to (0.45,-0.1) to (0.65,0) to (0.95,0.1) to (0.95,0.4) to (0.75,0.6) to (0.45,0.65) to (0,0.4) to close { Two wells, held at constant draw-down depths } start(sx1,sy1-srad) value(h) = -1 arc(center=sx1,sy1) angle=-360 start(sx2,sy2-srad) value(h) = -2 arc(center=sx2,sy2) angle=-360 Region 2 { Some regions of low porosity } k=k2 start(0,0) line to (0.25,-0.1) to (0.45,-0.1) to (0.45,0.05) to (0,0.05) to close start(0.95,0.1) line to (0.95,0.3) to (0.65,0.3) to (0.65,0) to close start(0.3,0.3) line to (0.5,0.4) to (0.5,0.6) to (0.3,0.5) to close Region 3 { A percolation pond } k = k2 s = ps { percolation rate } start (px,py-pr) arc(center=px,py) angle=360 monitors contour(h) plots grid(x,y) grid(x,y) zoom(sx1-w/2,sy1-w/2,w,w) grid(x,y) zoom(sx2-w/2,sy2-w/2,w,w) contour(h) as 'Head' contour(h) as 'Head' zoom(0.65,0.35,0.1,0.1) surface(h) as 'Head' end 142105208 Fertiges Beispiel: Script Water.PDE (auch in PDF – Form) Seminar Grundwasserwirtschaft WS2007/08 FlexPDE5 Kyriazis
Graphischer Output WATER.PDE Seminar Grundwasserwirtschaft WS2007/08 FlexPDE5 Kyriazis
Danke für Ihre Aufmerksamkeit! Seminar Grundwasserwirtschaft WS2007/08 FlexPDE5 Kyriazis