Download
1 / 11
110 likes | 200 Views
A new Graphical User Interface for ALFRED: the AL lele FRE quency D atabase. Nicholas P. Tosches, M.D., M.S. 2 , Haseena Rajeevan, Ph.D. 2 , Kei-Hoi Cheung, Ph.D. 2 , Shannon Stein, B.S. 1 , Hongyi Deng, M.S. 1 , Judith R. Kidd, Ph.D. 1 , Andrew J. Pakstis, Ph.D. 1 ,

E N D
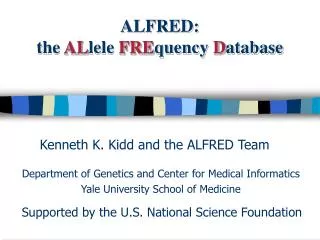
A new Graphical User Interface forALFRED: the ALlele FREquency Database Nicholas P. Tosches, M.D., M.S.2, Haseena Rajeevan, Ph.D.2, Kei-Hoi Cheung, Ph.D.2, Shannon Stein, B.S.1, Hongyi Deng, M.S.1, Judith R. Kidd, Ph.D.1, Andrew J. Pakstis, Ph.D.1, Perry L. Miller, M.D., Ph.D.2, Kenneth K. Kidd, Ph.D.1 1Department of Genetics, Yale University School of Medicine 2Center for Medical Informatics, Yale University School of Medicine http://alfred.med.yale.edu Supported by the U.S. National Science Foundation
ALFRED is Moving in Three Directions: 1. A new GIS-based graphical interface to display population data on a map 2. A new reusable search interface that is based on Extensible Markup Language (XML) 3. Expansion of the database by increasing the quantity, quality, and accessibility of data in ALFRED The GIS-based graphical interface is generated dynamically by querying geographical and population data stored in the database to create an SVG (scalar vector graphic, which is an XML-based markup language for manipulating graphical data) document which is displayed in the browser. This new interface will enable a user to make selections from the map based on geographic locations and follow the links for population information or allele frequency tables. This will facilitate retrieval of data on all populations in an arbitrarily defined geographic region without prior knowledge of the identities of the populations. Possibilities of further expanding this interface to include displaying chromosomes using ideograms of a karyotype where the typed loci for a population or set of populations can be plotted are being investigated. The new reusable search interface will enhance the graphical user interface of ALFRED by allowing the display of data in a hierarchical tree format from which the user can format queries, launch searches, and display results. The interface can be reused to display data about populations, chromosomes, loci, etc. by changing the XML message used to construct the interface. ALFRED currently has information on 917 polymorphic sites typed on at least one population sample and 383 populations typed for at least one polymorphism for a total of 18,299 frequency tables (one sample typed for one site). The database is updated on a daily basis. In addition to the major enhancements described above, several specific retrieval options have been implemented in the past year. For example, the list of publications underlying the data can now be searched by the name of any author and all allele frequency data from a publication quickly retrieved. In addition, researchers can now download data useful for analysis into a single compressed "data dump" file or smaller files of each table separately in the declared XML format. The XML files are updated twice a month.
ALFRED New Home Page Improvements to the present interface continue with a new tabbed menu for easier navigating
GIS-based World Map Interface Fields from the database can be selected to narrow down a search for specific populations. Here the Geographic Region of Africa was chosen and the resultant populations displayed on the map (Scalar Vector Graphic).
GIS-based World Map Interface Once the populations are displayed, a selection tool can be used to further filter the initial selection (selected population points shown in yellow). These populations are then listed in the text box above and can be forwarded to an additional page which in this instance shows the loci typed for at least one of the populations.
TreeView and TabForm Displays of Population Data TreeView Control TabForm Control The TreeView and TabForm controls are assembled from an XML message. Data is displayed in a hierarchical tree format (left) from which selections can be made to show detailed information regarding the selection in a tabbed-form (right). The code that constructs the skeleton of the tree and tabbed-form can be reused to display loci or chromosome data, for instance, by changing the XML message so that it contains loci or chromosome data selected from the database.
XML message generating Tree and TabForm displays (partial) The data and instructions for the tree view and tabbed-form are contained in this XML message sent by the server to the browser. This message is the result of a specific query on the database. An alternate query would result in different data and metadata but would reuse the same skeletal TreeView and TabForm controls.
XML-based Query Interface Individual fields can be selected and combined as a Boolean expression in order to filter a complex search of Frequency data. The query is constructed in XML, sent to the server where a standard SQL query is issued to the database. The results are then sent back to the browser in the form of XML and can be displayed in various formats such as HTML, XML and Text. These results can then be copied and pasted into an Excel spreadsheet if desired.
The ALFRED Team Senior Faculty Kenneth K. Kidd, Ph.D., Professor of Genetics and Psychiatry (ALFRED P.I.) Perry Miller, M.D., Ph.D., Director of Center for Medical Informatics Curators Hongyi Deng, M.S., Research Associate Shannon Stein, B.S., Research Assistant Programmers Haseena Rajeevan, Ph. D., Systems Programmer Nicholas P. Tosches, M.D., Associate Research Scientist Lyudmila Druskin, M.D., Postdoctoral Fellow and Associate Consultants Andrew J. Pakstis, Ph. D., Research Scientist Judith R. Kidd, Ph. D., Research Scientist Kei-Hoi Cheung, Ph. D., Assistant Professor