Download
1 / 27
270 likes | 369 Views
Understanding Trends in Occupational Sex Segregation. By Daniel Guinea-Martin Advanced Centre for Scientific Research , Spain (formerly at the Office for National Statistics, UK) Presented at the Research Methods Festival, Oxford University 1 st July 2008. Introduction: Aims and scopes.

E N D
Understanding Trends in Occupational Sex Segregation By Daniel Guinea-Martin Advanced Centre for Scientific Research, Spain (formerly at the Office for National Statistics, UK) Presented at the Research Methods Festival, Oxford University 1st July 2008
Introduction: Aims and scopes • Substantive scope: To study occupational sex segregation / occupational mobility in the 1990s • How? Complementing Census-based indices of segregation (Blackwell and Guinea-Martin 2005) with longitudinal research of one cohort born in the late 1950s: • NCDS • A similar cohort from the ONS Longitudinal Study
Introduction: Aims and scopes • Methodological aims: • To assess the effect of attrition on representativenes • To assess ‘founding’ assumption
LS Structure Events tables Continuous since 1971 until present Examples: Births to sample women Infant Deaths Widow(er)hoods Cancer registrations Deaths…. Census-based tables Four time points / Four tables: 1971-1981-1991-2001 Around 500,000 individuals each year Core Table Contains basic variables for ‘time constant’ characteristics (sex, decade of entry to or exit from the dataset…) Around 1 million individuals Key programming tool: Indexing commands, e.g. [i], [i+1]…
NCDS Structure Work-histories database (from 1974 onwards) - Combines restrospective information from NCDS5 & NCDS6 NCDS Sweep 5 (1991) NCDS Sweep 6 (2000) • Key programming tool: loops, e.g. • - foreach i in 1/25 {do whatever} -
A methodological auto-biography • The challenge: 1st serious research experience with complex and ‘messy’ longitudinal data • Easy to be surprised. Examples: • Supposedly time-invariant variables like sex or ethnicity might actually change across waves. • Easy to mistake ‘past’ variables for ‘current’ variables in life histories. • Easy to forget harmonising variables which categories change over time. • Different ways of storing variables in different tables and across time (e.g., numeric, string with trailing spaces…)
Survival kit • Read the documentation very closely, particularly the questionnaires. • Learn serious programming in one or two software packages: SPSS, Stata, R… • Keep the syntax of all the transformations you operate on the data in strict sequence. • In the syntax include comments on what you are doing and what you have found out about the data
Occupational sex segregation: Standardised Gini indices for the period 1971-1981 1971 1981 1991 1996 2001 2001 (CO70) (CO80) (SOC90) (SOC90) (SOC2000) (SOC90) Census - - 0.78 - 0.69 - LFS - - 0.76 0.75 0.72 ONS LS 0.81 0.80 0.77 - 0.70 0.72 (no person imp.) Source: Blackwell, L. and D. Guinea-Martin (2005) ‘Occupational segregation by sex and ethnicity in England and Wales, 1991 to 2001’, in Labour Market Trends, Vol. 113, No. 12, pp. 501-516
Male/female ratio What are these indices of segregation?Example: The Segregation Curve for NCDS 2000 Distance=D Gini=A/(A+B)
How to calculate the indices Index of dissimilarity Gini coefficient
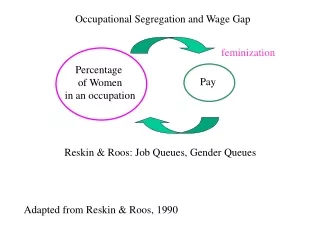
Decomposing segregation: Theil’s index • Theil’s entropy index of segregation (H) is a multi-group measure of segregation • Allows the incorporation of various dimensions, for example employment status (full time vs. part time) or age groups • Currently working on these dimensions to disaggregate the changes in occupational sex segregation during the 1990s
Theil’s entropy index of segregation ‘Entropy’ or diversity Theil’s index Decomposition of Theil’s H
Example: Decomposition of segregation among ISCO-88 occs in UK
Occupational sex segregation for various quasi-cohorts in the 1990s
Transitions across sex-typed occupations (occupational movers only)
Transitions across sex-typed occupations (occupational movers only)
Transitions across sex-typed occupations (occupational movers only)
Transition tables across SOC90 Major Groups and NIW:NCDS women (cell percentages)
Transitions with greatest effect in the lack of fit of Model 2 (St.Residual>=|1.96|) Notes: Only transitions with n>=50 in each dataset are included Sources: Authors’ analysis. ONS Longitudinal Study and NCDS
Bibliography • Blackburn, R et al (2001) ‘Occupational stratification’, in Work, Employment and Society, 15(3): 511-38. • Blackburn, R. and J.Jarman (2005) ‘Segregation and inequality’. GeNet Working Paper No.3 • Blackwell, L. and D.Guinea-Martin (2005) ‘Occupational segregation by sex and ethnicity in England and Wales, 1991 to 2001’, Labour Market Trends, 113(12): 501-516. • Elliott, J. (2005) ‘Comparing occupational segregation in Great Britain and the United States’, Work, Employment and Society, 19(1): 153-174 • Gilbert, N. (1981) Modelling Society. And introduction to loglinear analysis for social researchers. London: George Allen&Unwin • Guinea-Martin, D. and J. Elliott (2008) ‘Economic position and occupational segregation in the 1990s’, Centre for Longitudinal Studies Working Paper • James, D. and K.E.,Taeuber (1985) ‘Measures of segregation’, in Sociological Methodology, 15: 1-32 • Ramson, M.R. (2000) ‘Sampling distributions of segregation indexes’, Sociological Methods and Research, 28(4): 454-475