Download
1 / 36
360 likes | 499 Views
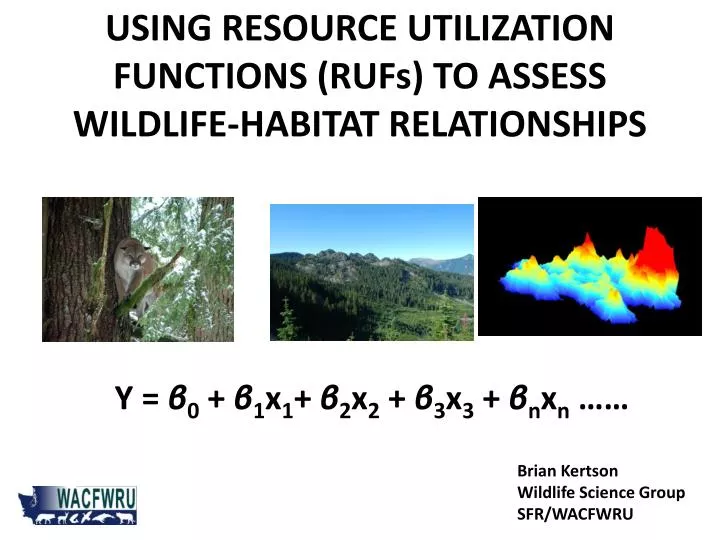
USING RESOURCE UTILIZATION FUNCTIONS (RUFs) TO ASSESS WILDLIFE-HABITAT RELATIONSHIPS. Y = β 0 + β 1 x 1 + β 2 x 2 + β 3 x 3 + β n x n ……. Brian Kertson Wildlife Science Group SFR/WACFWRU. HABITAT IS THE KEY FOR WILDLIFE. Understanding relationships is critical -Food -Reproduction

E N D
USING RESOURCE UTILIZATION FUNCTIONS (RUFs) TO ASSESS WILDLIFE-HABITAT RELATIONSHIPS Y = β0+ β1x1+ β2x2 + β3x3 + βnxn …… Brian Kertson Wildlife Science Group SFR/WACFWRU
HABITAT IS THE KEY FOR WILDLIFE • Understanding relationships is critical -Food -Reproduction -Survivorship -Predator-prey dynamics -Behavior and ecology • Management and conservation
KEY TERMINOLOGY • Use: how much, how often – metric matters • Selection/Avoidance: animal uses resource more or less than available • Preference: animal selects between 2 equally available resources
WILDLIFE-HABITAT METHODS • Many analytical procedures available • Common techniques: -Compositional Analysis -Resource Selection Functions (RSFs) -Resource Selection Probability Functions (RSPFs) • Varying degrees of rigor, each has advantages and disadvantages
COMMON PROBLEMS • Lack of independence of observations • Incorrect sampling unit • Habitat data and scale -Use of remote sensing • Unit-sum constraint • Discrete use • Failure to connect with behavior (i.e., fitness)
USED VS. UNUSED LIMIATIONS • Logistic regression • Contamination: -Classified as unused when it was used -GPS -Snow tracking -Critter cams
PROBLEMS DEFINING AVAILABILITY You know nothing!! • Can we know how animals perceive their environment? • Do we actually know what is available? • NO!!!!!!!!!!!!!!!!!!!!!!!!!!!!!!! • Arbitrary • Home range simulations: -Rigorous: potentially -Biologically meaningless Stupid hairless monkeys.
ADDITIONAL AVAILABILITY ISSUES Kertson and Marzluff, in press
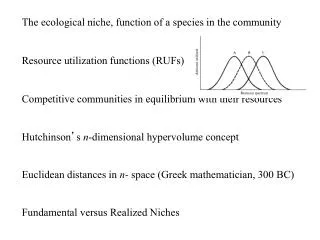
Resource Utilization Functions • Marzluff et al. 2004 (Ecology) • Continuous: -High vs. low use (relative comparison) • Multivariate: -Multiple regression • Individual is sampling unit: -Quantify individual variation • No measure of availability
HOW THE RUF WORKS 99% Utilization Distribution (Use values) Animal relocations Sampling grid Ruf.fit Use and habitat covariates
KEY TOOLS ArcMap 9.x Hawth’s Tools: http://www.spatialecology.com/htools/index.php -Bivariate kernel Excel or Notepad R statistical computing -Ruf.fit package http://csde.washington.edu/~handcock/ruf/
MEASURING USE • Individual = sampling unit • Sampling design critical -Individuals -Monitoring • Increase monitoring, more refined UD • VHF vs. GPS: -Increased resolution -Increased accuracy -Not perfect Kertson and Marzluff, in press
UTILIZATION DISTRIBUTION (UD) • Animal use is not random -Gradient of use • Probability Density Function (pdf) -Sums to 1 • Use = height (volume) of UD
UD ESTIMATION • Fixed kernel • Min. of 30 relocations -Preferably n ≥ 50 • Resolution (grid size): -25 or 30 m common • Bandwidth smoothing (h) -Most critical component
SELECTION OF h • Selection: data • Over vs. under-smoothing • Univariate vs. bivariate • Lots of options: -Reference (HREF) -Least-squares cross-validation (LSCV) -Plug in (PI) -Solve the equation (STE) -Biased cross validation (BCV) • Each has +/-
EFFECTS OF h ON UD Kertson and Marzluff, in press
ESTIMATING h • Animal Movements Extension (ArcView 3.3) • ArcMap 9.x: -Home Range Tools (HRT) *LSCV, BCV, HREF • R statistical computing: -KernSmooth package -KS package *PI values from both (bivariate)
UD CHALLENGES • UD size can push the limits of software: -Male cougar UDs can exceed 2.0 million points • Over-smoothing: -Lakes, rivers, major highways, and other unsuitable/unusable habitat • Under-smoothing: -Donut holes and disconnect cores • Solutions: -Clip UD (over-smoothing) -Adjust h (try different bandwidth method) -Little bit of black magic here
LANDSCAPE COVARIATES • Covariate types: -Categorical -Continuous • Resolution: -As fine as possible -Landscape configuration -Remote sensing • Transformations: -Can improve model performance Percent Conifer Forest Distance to Water
CATEGORICAL COVARIATES • Common categorical covariates: -Landcover -Aspect • Classes for each variable are not independent • Must be recoded 0,1 -No. of columns = no. of classes
RUF.FIT • Developed by Dr. Mark Handcock (UW-CSSS) • Multiple regression: Y = β0+ β1x1+ β2x2 + β3x3 + βnxn …… • Code: Cat1<- ruf.fit(USE ~ COV1 + COV2 + COV3 + COV4, space= ~ X + Y, data=data_file, theta=hval, name=“whatever_you_want", standardized=F) • Corrects for spatial dependence in UD • Unstandardized and standardized coefficients
MODEL COEFFICIENTS • Average for sample • Coefficient signs: -Increase use (+); decrease use (-) • Unstandardized: -Mapping predicted occurrence • Standardized: -Statistical significance of individual covariates -Differences between covariates -Relative importance -Proportion of sample +/- influence
RUF.FIT OUTPUT > summary(CAT1) Standardized Coefficients for name: Misska Matern Log-Lik = -9195.395 LS Log-Lik = -9331.533 Change in Log-Lik 136.1377 p-value = < 1e-04 MLE s.e. LS estimate LS s.e. range 149.277454 5.437344 NA NA smoothness 1.500000 NA NA NA (Intercept) 30.387746 0.117809 16.851820 0.107699 PCCREG 7.008595 0.223041 0.265138 0.001150 PCF 8.226134 0.283357 0.221347 0.000960 PFOREST -0.371450 0.191588 -0.018902 0.001464 DWATER -2.234107 0.161222 -0.011138 0.000153 DISTEDGE 3.158826 0.178807 0.053626 0.000406 DISTROAD -0.565676 0.120716 -0.004882 0.000147 DRESD -6.581544 0.225750 -0.004287 0.000025 RESDENS1KM 0.854841 0.095044 0.005812 0.000373 PAR -1.252951 0.599006 -0.078281 0.001941 SLOPE 0.272329 0.308374 0.004249 0.001152 DEM 5.641831 0.406940 0.002025 0.000015 βand associated SE
HOW DOES LANDSCAPE INFLUENCE COUGAR-HUMAN INTERACTION? • Apex predator with a large home range • Largest geographic distribution of any terrestrial mammal in western hemisphere -Tremendous habitat diversity • Key landscape resources: -Ungulate prey -Cover • High levels of interaction with people
METHODOLOGY • Captured 32 cougars in western WA, outfitted with GPS collars • Investigated interaction reports • Focused on landscape metrics I suspect correlate with prey and cover • Modeled with RUF • Quantified individual variation
CONSERVATION AND MANAGEMENT IMPLICATIONS • Identify key resources to manage and conserve • Identify high quality habitats • Develop proactive management strategies -71.5% of confirmed interactions occurred in high and med-high use habitats -Management hotspots • Space use and interactions with people highly individualized -Population approaches may not work
ADDITIONAL APPROACHES • Sex and age specific RUFS: -Male vs. female -Adult vs. subadult • Behavior specific: -Movement rates -Relates habitat use to different aspects of fitness Traveling Resting/Feeding Hunting Nursing
RUF CHALLENGES • The more RAM the better • Capable of running full data set, may need to sub-sample • Processing time can be significant • Model comparisons (e.g., model parsimony) difficult -RUF outputs log-likelihoods (ΔAIC)
RUF LIMITATIONS • Models are tools, not absolute truth • Results are only as good as the data used -Limitations and accuracy of remotely-sensed data • Do the results pass the laugh test? • Subject to same assumptions as normal multiple regression • No alternatives for correcting spatial dependence in UD