1 / 29

Smart well zonal allocation

Smart well zonal allocation. The Problem.

tangia
Download Presentation

Smart well zonal allocation

An Image/Link below is provided (as is) to download presentation Download Policy: Content on the Website is provided to you AS IS for your information and personal use and may not be sold / licensed / shared on other websites without getting consent from its author. Content is provided to you AS IS for your information and personal use only. Download presentation by click this link. While downloading, if for some reason you are not able to download a presentation, the publisher may have deleted the file from their server. During download, if you can't get a presentation, the file might be deleted by the publisher.

E N D

Presentation Transcript


  1. Smart well zonal allocation

  2. The Problem • To run smart wells at its optimum level it must be possible to determine the zonal reservoir pressure at any time and compare those with the theoretical expected pressure calculated from your well and network models. A comparison of the theoretical value with the actual calculated value is a key performance indicator if the well/reservoir behaved as expected. If not the system needs to be recalibrated.

  3. The Team • IP21 by Aspentech is the data historian • EnergyComponents by TietoEnator is the production database • Prosper by Petroleum Experts is a Well modelling application • DECIDE! By Schlumberger is the orchestrator of automated workflows and data consolidation • Avocet Production Surveillance by Schlumberger is the visualization tool • Avocet - Integrated Asset Modeller (IAM) by Schlumberger is the optimizer and forecaster

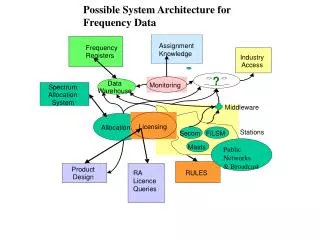
  4. 1 Set up IAM model models Historical P&I data are collected 2 Trigger time base every X minutes 4 8 Determine well type Set P&I Targets Pressure per zone, calculate zonal & total rates Poll well information 7 3 6 Poll Data Historian 5 9 Simulate well performance Alarm if targets or constrains are not met 12 14 Trigger an update of the IAM model Do the cause analysis Calculate reservoir pressure per zone Calculates choke positions 13 11 10 The interactions 9 13 PETEX Prosper/GAP APS 8 7a 7b 4 Decide! 10 1 14b IAM 12a 12b 14a 3b 3a 2b 6b 2a 6a 5b 11b Advanced Process Control 5a 11a 11 TE EnergyComponents Aspentech IP21

  5. Setup the IAM model

  6. Set P&I Targets

  7. Create new PRODML connection

  8. Point to TietoEnator’s web service

  9. Define the well(s) to query for

  10. Define the parameter(s) to query for

  11. View resulting query and response

  12. View data that is to be acquired

  13. …and acquire it to DECIDE!

  14. Create new PRODML connection

  15. Point to Aspentech web service

  16. Select the well(s) to query for

  17. Define the parameter(s) to query for

  18. View query template and results

  19. View query template and results

  20. Optionally data cleansing rules to the data

  21. View resulting data that will be acquired

  22. Finish initial data acquisition

  23. This connection can than be automated…

  24. …in a DECIDE! workflow

  25. Advanced Process Control New IAM data (5% Increase) Sample: 180 185 190 195 200 290 295 300 305 New velocity limit

  26. The web viewer can visualize the acquired data

  27. and the calculated pressures

  28. Calculated KPI for monitoring the performance

  29. Rerun optimization if performance declines

More Related