Download
1 / 47
470 likes | 672 Views
Cost-Sensitive Classifier Evaluation. Robert Holte Computing Science Dept. University of Alberta Co-author Chris Drummond IIT, National Research Council, Ottawa. Classifiers. A classifier assigns an object to one of a predefined set of categories or classes. Examples:

E N D
Cost-Sensitive Classifier Evaluation Robert Holte Computing Science Dept. University of Alberta Co-author Chris Drummond IIT, National Research Council, Ottawa
Classifiers • A classifier assigns an object to one of a predefined set of categories or classes. • Examples: • A metal detector either sounds an alarm or stays quiet when someone walks through. • A credit card application is either approved or denied. • A medical test’s outcome is either positive or negative. • This talk: only two classes, “positive” and “negative”.
Two Types of Error False negative (“miss”), FN alarm doesn’t sound but person is carrying metal False positive (“false alarm”), FP alarm sounds but person is not carrying metal
2-class Confusion Matrix • Reduce the 4 numbers to two rates true positive rate = TP = (#TP)/(#P) false positive rate = FP = (#FP)/(#N) • Rates are independent of class ratio* * subject to certain conditions
Example: 3 classifiers Classifier 1 TP = 0.4 FP = 0.3 Classifier 2 TP = 0.7 FP = 0.5 Classifier 3 TP = 0.6 FP = 0.2
Assumptions • Standard Cost Model • correct classification costs 0 • cost of misclassification depends only on the class, not on the individual example • over a set of examples costs are additive • Costs or Class Distributions: • are not known precisely at evaluation time • may vary with time • may depend on where the classifier is deployed • True FP and TP do not vary with time or location, and are accurately estimated.
How to Evaluate Performance ? • Scalar Measures • Accuracy • Expected cost • Area under the ROC curve • Visualization Techniques • ROC curves • Cost Curves
What’s Wrong with Scalars ? • A scalar does not tell the whole story. • There are fundamentally two numbers of interest (FP and TP), a single number invariably loses some information. • How are errors distributed across the classes ? • How will each classifier perform in different testing conditions (costs or class ratios other than those measured in the experiment) ? • A scalar imposes a linear ordering on classifiers. • what we want is to identify the conditions under which each is better.
What’s Wrong with Scalars ? • A table of scalars is just a mass of numbers. • No immediate impact • Poor way to present results in a paper • Equally poor way for an experimenter to analyze results • Some scalars (accuracy, expected cost) require precise knowledge of costs and class distributions. • Often these are not known precisely and might vary with time or location of deployment.
Why visualize performance ? • Shape of curves more informative than a single number • Curve informs about • all possible misclassification costs* • all possible class ratios* • under what conditions C1 outperforms C2 • Immediate impact (if done well) * subject to certain conditions
Example: 3 classifiers Classifier 1 TP = 0.4 FP = 0.3 Classifier 2 TP = 0.7 FP = 0.5 Classifier 3 TP = 0.6 FP = 0.2
ROC plot for the 3 Classifiers Ideal classifier always positive chance always negative
Operating Range ditto for always-positive Slope indicates the class distributions and misclassification costs for which the classifier is better than always-negative
Convex Hull Slope indicates the class distributions and misclassification costs for which the red classifier is the same as the blue one.
Creating an ROC Curve • A classifier produces a single ROC point. • If the classifier has a “sensitivity” parameter, varying it produces a series of ROC points (confusion matrices). • Alternatively, if the classifier is produced by a learning algorithm, a series of ROC points can be generated by varying the class ratio in the training set.
ROC curves for two classifiers. When to switch from C4.5 to IB1 ? What is the performance difference ? How to tell if two ROC curves’ difference is statistically significant ? When to use the default classifiers ?
ROC curves from two cross-validation runs. How to average them? How to compute a confidence interval for the average ROC curve ?
And we would like be able to answer all these questions by visual inspection …
1.0 0.8 0.6 Error Rate 0.4 0.2 FN = 1-TP FP 0.0 0.0 0.2 0.4 0.6 0.8 1.0 Probability of Positive P(+) Cost Curves (1) Classifier 1 TP = 0.4 FP = 0.3 Classifier 2 TP = 0.7 FP = 0.5 Classifier 3 TP = 0.6 FP = 0.2
1.0 “always positive” “always negative” 0.8 0.6 Error Rate 0.4 0.2 Operating Range 0.0 0.0 0.2 0.4 0.6 0.8 1.0 Probability of Positive P(+) Cost Curves (2)
1.0 0.8 0.6 Error Rate 0.4 0.2 0.0 0.0 0.2 0.4 0.6 0.8 1.0 Probability of Positive P(+) Lower Envelope
1.0 0.8 0.6 Error Rate 0.4 0.2 0.0 0.0 0.2 0.4 0.6 0.8 1.0 Probability of Positive P(+) Cost Curves “always positive” “always negative”
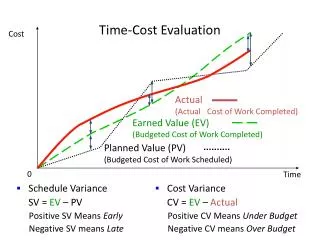
p(+) • C(-|+) X = p(+) • C(-|+) + (1-p(+)) • C(+|-) Taking Costs Into Account Y = FN•X + FP •(1-X) So far, X = p(+), making Y = error rate Y = expected cost normalized to [0,1]
True Predicted True Predicted pos neg pos neg pos 75 25 pos 83 17 neg 45 55 neg 38 62 Resample #1 TP = 0.75 FP = 0.45 Resample #2 TP = 0.83 FP = 0.38 Confidence Intervals Original TP = 0.78 FP = 0.4 Resample confusion matrix 10000 times and take 95% envelope
Paired Resampling to Test Statistical Significance For the 100 test examples in the negative class: FP for classifier1: (30+10)/100 = 0.40 FP for classifier2: (30+0)/100 = 0.30 FP2 – FP1 = -0.10 Resample this matrix 10000 times to get (FP2-FP1) values. Do the same for the matrix based on positive test examples. Plot and take 95% envelope as before.
Paired Resampling to Test Statistical Significance classifier1 classifier2 FP2-FP1 FN2-FN1
Correlation between Classifiers High Correlation Low Correlation (same FP1 and FP2 as above)
Low correlation = Low significance classifier1 classifier2 FP2-FP1 FN2-FN1
ROC, Selection procedure Suppose this classifier was produced by a training set with a class ratio of 10:1, and was used whenever the deployment situation had a 10:1 class ratio.
Conclusions • Scalar performance measures should not be used if costs and class distributions are not exactly known or might vary with time or location. • Cost curves enable easy visualization of • Average performance (expected cost) • operating range • confidence intervals on performance • difference in performance and its significance
Fin • Cost curve software is available. Contact: holte@cs.ualberta.ca • Thanks to Alberta Ingenuity Centre for Machine Learning (www.aicml.ca)