Download
1 / 64
640 likes | 787 Views
Competition Graphs and the Dimensions of Biodiversity. Midge Cozzens, Rutgers University NIMBIOS August 16-18, 2010. Indicators of Biodiversity. One of the key goals of conservation biology is preservation of biodiversity. But what is biodiversity? Long history of trying to define it.

E N D
Competition Graphs and the Dimensions of Biodiversity Midge Cozzens, Rutgers University NIMBIOS August 16-18, 2010
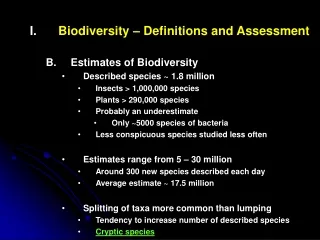
Indicators of Biodiversity • One of the key goals of conservation biology is preservation of biodiversity. • But what is biodiversity? • Long history of trying to define it. • It is a multidimensional concept.
Indicators of Biodiversity • Traditional approaches to biodiversity consider: • Richness = number of species • Evenness = extent to which species are equally distributed • Indicator species = organism that serves as a measure of environmental conditions
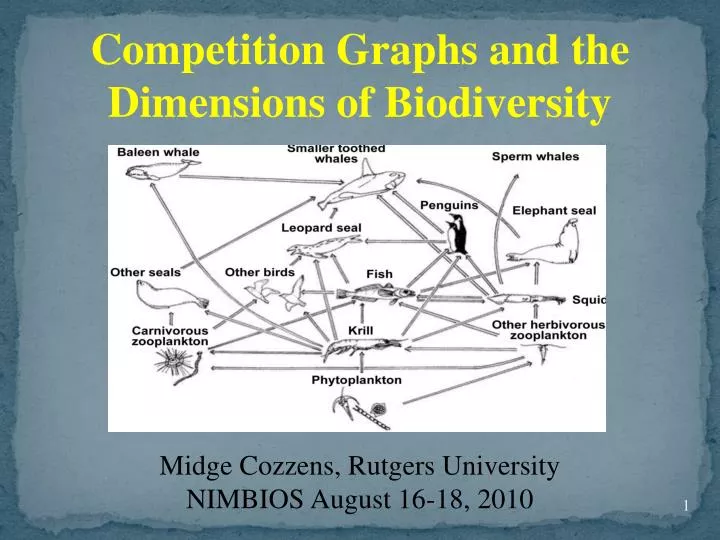
Competition Graphs • We will try to derive the “dimensions” of biodiversity starting from properties of ecosystems, in particular normal, healthy competition between species. • Based on idea of competition graph • Arose from a problem of ecology. • Joel Cohen 1968 • Key idea: Two species compete if they have a common prey.
Competition Graphs of Food Webs owl fox ant speargrass deer Food Webs Let the vertices of a directed graph (digraph) be species in an ecosystem. Include an arc from x to y if x preys on y. Usual assumption for us: no cycles.
Competition Graphs of Food Webs Consider a corresponding undirected graph. Vertices = the species in the ecosystem Edge between a and b if they have a common prey, i.e., if there is some x so that there are arcs from a to x and b to x.
owl ant owl deer spear grass fox fox ant speargrass deer
Competition Graphs More generally: Given a digraph D = (V,A) (Usually assumed to be acyclic.) The competition graph C(D) has vertex set V and an edge between a and b if there is an x with arcs (a,x) ε A and (b,x) ε A.
Mathematical Aside: Interval Graphs • A key idea in the study of competition graphs is the notion of interval graph. It arose from a problem in genetics posed by Seymour Benzer. • Benzer’s Problem (1959): The problem was: How can you understand the “fine structure” inside the gene without being able to see inside?
Benzer’s Problem • Classically, geneticists had treated the chromosome • as a linear arrangement of genes. • Benzer asked in 1959: Was the same thing true • for the “fine structure” inside the gene?
Benzer’s Problem • At the time, we could not observe the fine structure • directly. • Benzer studied mutations. • He assumed mutations involved “connected • substructures” of the gene. • By gathering mutation data, he was able to surmise • whether or not two mutations overlapped.
Benzer’s Problem i,j entry is 1 if mutations Si and Sj overlap, 0 otherwise.
Benzer’s Problem S4 S6 S2 S3 S1 S5
Benzer’s Problem • If we represent the tabular (matrix) information • as a graph, we say that the graph is an interval graph if it is consistent with a linear arrangement. • That is: A graph is an interval graph if we can find intervals on the line so that two vertices are joined by an edge if and only if their corresponding intervals overlap. • Interval graphs have been very important in genetics. Long after Benzer’s problem was solved using othermethods, interval graphs played a crucial role in physical mapping of DNAand more generally in the mapping of the human genome.
Benzer’s Problem • Given a graph, is it an interval graph? c a b d e • We need to find intervals on the line that have the same overlap properties a b e d c
a x c b y z Benzer’s Problem • The following is not an interval graph.
a x c b y z Benzer’s Problem • The following is not an interval graph. a b c
Intersection of Boxes More generally, we can study ways to represent graphs where the edges correspond to intersections of boxes in Euclidean space. The boxicity of G is the smallest p so that we can assign to each vertex of G a box in Euclidean p-space so that two vertices are neighbors iff their boxes overlap. Well-defined (Roberts 1968) but hard to compute (Cozzens 1980).
Intersection of Boxes b a G = C4 d c • Interval graphs are the graphs of boxicity 1. • Consider the graph C4. • It is not an interval graph. • However, it can be represented as the intersection graph of boxes in 2-space. • So, boxicity of C4 is 2.
Intersection of Boxes b a G = C4 d c • C4 can be represented as the intersection graph of boxes in 2-space. • So, boxicity of C4 is 2. b a c d
Factors Affecting Biodiversity • Different factors determine a species’ normal healthy environment. • Moisture • Temperature • pH • … • We can use each such factor as a dimension. • Then the range of acceptable values on each dimension is an interval. • Each species can be represented as a box in Euclidean space. • The box represents its ecological niche.
Factors Affecting Biodiversity Moisture m m1 m0 • The ecological niche is a box. t0 t1 Temp t
Factors Affecting Biodiversity Moisture m m1 m0 • Simplifying assumption: acceptable ranges on each dimension are independent of values on other dimensions. t0 t1 Temp t
Factors Affecting Biodiversity t0 t1 Temp t • The ecological niche is a box. Moisture m pH p m1 p1 m0 p0
Competition • Old ecological principle: Two species compete if and only if their ecological niches overlap. • Joel Cohen (1968): • Start with an independent definition of competition • Map each species into a box (niche) in k-space so competition corresponds to box overlap (niche overlap) • Find smallest k that works.
Competition • Specifically, Cohen started with the competition graph as defined before. • The question then becomes: What is the boxicity of the competition graph?
owl ant owl deer spear grass fox fox ant speargrass deer
owl ant deer spear grass fox This is an interval graph. Thus, boxicity is 1. owl ant fox spear grass deer
3 2 4 5 6 7 1 • Key: • Juvenile Pink Salmon • P. Minutus • Calanus & Euphasiid Barcillia • Euphasiid Eggs • Euphasiids • Chaetoceros Socialis & Debilis • Mu-Flagellates Strait of Georgia, British Columbia, Canada Due to Parsons and LeBrasseur From Joel Cohen, Food Webs and Niche Space Princeton University Press, 1978
1 4 3 5 2 7 6 1 Competition graph 3 2 4 5 6 7 Strait of Georgia, British Columbia, Canada
1 4 3 5 2 7 6 Competition graph What is the boxicity of the competition graph? Strait of Georgia, British Columbia, Canada
Competition graph This is an interval graph. Thus, its boxicity is 1. 1 4 3 5 1 3 4 5 2 2 6 7 6 7 Strait of Georgia, British Columbia, Canada
5 2 3 10 8 7 6 4 1 11 9 • Key • Canopy – leaves, fruits, flowers • Canopy animals – birds, bats, etc. • Upper air animals – insectivores • Insects • Large ground animals – large mammals & birds • Trunk, fruit, flowers • Middle-zone scansorial animals • Middle-zone flying animals • Ground – roots, fallen fruit, leaves • Small ground animals • Fungi • Key • Canopy – leaves, fruits, flowers • Canopy animals – birds, bats, etc. • Upper air animals – insectivores • Insects • Large ground animals – large mammals & birds • Trunk, fruit, flowers • Middle-zone scansorial animals • Middle-zone flying animals • Ground – roots, fallen fruit, leaves • Small ground animals • Fungi 5 2 3 10 8 7 6 4 1 11 9 Malaysian Rain Forest Due to Harrison From Cohen, Food Webs and Niche Space Malaysian Rain Forest Due to Harrison From Cohen, Food Webs and Niche Space 33
5 2 3 10 8 7 4 4 5 5 6 4 1 10 10 11 2 2 9 3 3 7 7 8 8 1 1 6 6 Competition Graph Competition Graph 5 2 3 10 8 7 11 11 6 4 1 11 9 Malaysian Rain Forest Malaysian Rain Forest 34 9 9
4 5 10 2 3 7 8 1 6 Competition Graph What is the boxicity of the competition graph? 11 Malaysian Rain Forest 35 9
4 5 10 2 3 7 8 9 1 6 Competition Graph This is an interval graph. Thus, its boxicity is 1. 11 11 4 2 7 5 8 3 10 9 1 6 Malaysian Rain Forest 36
Structure of Competition Graphs • In the first 12 years after this problem was introduced, every food web studied was found to have a competition graph that was an interval graph. • In 1976, a Rutgers undergraduate, Gordon Kruse, found the first example of a food web whose competition graph was not an interval graph. • It arose from a complex set of habitats. • Generally: Food webs arising from “single habitat ecosystems” (homogeneous ecosystems) have competition graphs that are interval graphs.
Structure of Competition Graphs The remarkable empirical observation of Cohen’s that real-world competition graphs are usually interval graphs has led to a great deal of research on the structure of competition graphs and on the relation between the structure of digraphs and their corresponding competition graphs, with some very useful insights obtained. Competition graphs of many kinds of digraphs have been studied. In most of the applications of interest, the digraphs studied are acyclic.
Structure of Competition Graphs • The explanations for the empirical observation have taken two forms: • Statistical • Graph-theoretical
Structure of Competition Graphs • Statistical Explanations: • Develop models for randomly generating food webs • Calculate probability that the corresponding competition graph is an interval graph • Much of Cohen’s Food Webs and Niche Space takes this approach. • Cascade model developed by Cohen, Newman, and Briand. But Cohen and Palka showed that under this model, the probability that a competition graph is an interval graph goes to 0 as the number of species increases.
Structure of Competition Graphs • Graph-theoretical Explanations: • Analyze the properties of competition graphs that arise from different kinds of digraphs. • Characterize the digraphs whose corresponding competition graphs are interval graphs. • Much known about the former problem. • Latter problem remains the fundamental open problem in the subject.
The Competition Number Suppose D is an acyclic digraph. Then its competition graph must have an isolated vertex (a vertex with no neighbors). Theorem: If G is any graph, adding sufficiently many isolated vertices produces the competition graph of some acyclic digraph. Proof: Construct acyclic digraph D as follows. Start with all vertices of G. For each edge {x,y} in G, add a vertex α(x,y) and arcs from x and y to α(x,y). Then G together with the isolated vertices α(x,y) is the competition graph of D.
c b b a a d D G = C4 α(b,c) α(c,d) α(a,b) d c α(a,d) b a α(a,b) α(b,c) C(D) = G U I4 α(c,d) α(a,d) d c The Competition Number
The Competition Number • Thus, D as shown in previous slide has a competition graph that is not an interval graph. • In fact, there are examples of competition graphs of acyclic digraphs that have arbitrarily high boxicity. • Just start with a graph of boxicity b. • Add sufficiently many isolated vertices to make the graph into a competition graph. • (Adding isolated vertices does not change the boxicity.) • Thus, the empirical observations tracing back to Joel Cohen are truly surprising.
The Competition Number If G is any graph, let k be the smallest number so that G U Ik is a competition graph of some acyclic digraph. k = k(G) is well defined. It is called the competition number of G. Thus k(C4) = 4 from the previous example
The Competition Number Competition numbers and boxicity are known for many interesting graphs and classes of graphs. However: Theorem (Cozzens 1980): It is NP-complete to determine the boxicity of a graph, even if a graph has boxicity greater than or equal 2. Theorem (Opsut 1982): It is an NP-complete problem to compute k(G).
The Competition Number • Characterization of which graphs arise as competition graphs of acyclic digraphs comes down to the question: Given a graph, how many isolated vertices is it necessary to add to make it into a competition graph? • There has been extensive work over the years on algorithms for calculating the competition number.
Data Gathering: Community Food Webs, Sink Food Webs, Source Food Webs • How one gathers data about food webs can influence your conclusions about competition graphs, biodiversity, etc. • A community food web includes all predation relations among species. • In practice, we don’talways get all this data. We might start with some species, look for species they prey on, look for species they prey on, etc.
Data Gathering: Community Food Webs, Sink Food Webs, Source Food Webs • Suppose F is a community food web. • Let W be a set of species in F (ones we start with). • Let X be the set of all species that are reachable by a path in F from vertices in W. • So, we start with vertex of W, find its prey, find prey of the prey, etc. • Let Y be the set of all species that reach vertices of W by a path in F. • So we start with vertex of W, find its predators, find predators of those predators, etc.
Data Gathering: Community Food Webs, Sink Food Webs, Source Food Webs • Suppose F is a community food web. • Let W be a set of species in F (ones we start with). • Let X be the set of all species that are reachable by a path in F from vertices in W. • The subgraph induced by vertices of X is called the sink food web corresponding to W. • Let Y be the set of all species that reach vertices of W by a path in F. • The subgraph induced by vertices of Y is called the source food web corresponding to W.