Download

1 / 24
240 likes | 324 Views
Hardware Support for Out-of-Order Instruction Profiling on Alpha 21264a. Lance Berc & Mark Vandevoorde Joint work with: Jennifer Anderson, Jeff Dean, Sanjay Ghemawat, Shun-Tak Leung, Mitch Litchenberg, Gerard Vernes, Carl Waldspurger, William E. Weihl, and Jonathan White dcpi@pa.dec.com

E N D
Hardware Support for Out-of-Order Instruction Profiling on Alpha 21264a Lance Berc & Mark Vandevoorde Joint work with: Jennifer Anderson, Jeff Dean, Sanjay Ghemawat, Shun-Tak Leung, Mitch Litchenberg, Gerard Vernes, Carl Waldspurger, William E. Weihl, and Jonathan White dcpi@pa.dec.com http://www.research.compaq.com/SRC/dcpi/ Compaq Systems Research Center Palo Alto, CA 94301 USA
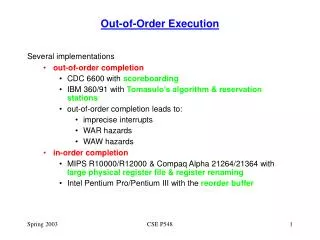
Trends • More aggressive CPUs • More performance puzzles • Widening gap in peak-vs-actual performance • More sophisticated performance tools • Digital Continuous Profiling Infrastructure (DCPI) • Where CPU cycles went • Where peak performance was lost and why • Efficient: hardware support, not simulation
Detailed Information Matters DCPI experience on the Alpha • TPC-D: 10% speedup • AltaVista: 15% (so far) • Compress program: 22% • Compiler improvements: 20% in several SPEC benchmarks All required instruction-level information
Instruction Information Where peak performance is lost and why Can display source code, too. CPI stall reasons PC 1.0 1.0s 0x18 addq s0,t6,t6 3.5 .5b 3.0D 0x1c ldl t4,0(t6) 21.0 1.5a 19.5d 0x20 xor t4,t12,t5 0.0 0x24 beq 0x3c
Traditional Performance Counters • Count events, interrupt when counter rolls over cycles, issues, loads, L1 Dcache misses, branch mispredicts, ... • Alpha 21064, 21164; Ppro, PII; R10k, … • Easy to measure total cycles, issues, CPI, etc. • Basic information is restart PC
Problem: Inaccurate Attribution • Experiment • count data loads • loop: single load +hundreds of nops • In-Order Processor • Alpha 21164 • skew • one large peak load nop nop nop nop nop nop nop nop nop nop nop nop nop nop nop nop nop nop nop nop nop nop nop nop nop Skew
Problem: Inaccurate Attribution • Experiment • count data loads • loop: single load +hundreds of nops • In-Order Processor • Alpha 21164 • skew • one large peak • Out-of-Order Processor • Intel Pentium Pro • skew • smear load nop nop nop nop nop nop nop nop nop nop nop nop nop nop nop nop nop nop nop nop nop nop nop nop nop Skew Smear
ProfileMe: Instruction Sampling Need new kind of performance counters Sample instructions, not events • Count fetched instructions • Save PC of sampled instruction • Interrupt handler reads Internal Processor Register • Makes skew and smear irrelevant • Save execution information in IPRs • Simplifies data analysis
ProfileMe on Alpha 21264a Fetch counter overflow? fetch map issue exec retire randomselection ProfileMe tag! interrupt branchpredictor icache tagged? capture! trapped? trap type retired? delay pc miss? prediction internal processor registers
Software Support (DCPI) • Interrupt handler aggregates samples • Cache-aware • Daemon writes samples to profile DB • <Executable, PC> Samples • Profile tools read DB • Low overhead • Roughly 4% slowdown • Roughly 14Mb disk for 7-hour benchmark suite
Instruction-Level Information Measured Data Computed Metric • PC + Retire Status execution count • PC + Cache Miss Flag cache miss rates • PC + Mispredict mispredict rates • PC + Event Flag event rates • PCs + Retire Delay Instruction Level Parallelism
Pointer-Chasing Loops while (p) p = *p; PC 0x30 ldq a0, 0(a0) 0x34 bne a0, 0x30
Pointer-Chasing Loops while (p) p = *p; retires delay misp (count) (avg) retires PC 8537 1.99 0x30 ldq a0, 0(a0) # L1 hit 8661 1.01 .006 0x34 bne a0, 0x30
Pointer-Chasing Loops while (p) p = *p; retires delay misp (count) (avg) retires PC 8537 1.99 0x30 ldq a0, 0(a0) # L1 hit 8661 1.01 .006 0x34 bne a0, 0x30 610 2.00 0x30 ldq a0, 0(a0) # L2 hit 605 23.06 .007 0x34 bne a0, 0x30 241 1.99 0x30 ldq a0, 0(a0) # Main Mem 205 138.13 .005 0x34 bne a0, 0x30
Traditional Counter Data cycles PC (count) 476 0x400 lds $f9, 19412(at) 1 0x404 stt $f1, 256(sp) 0 0x408 s4addl a5, 0x1, a5 1 0x40c stl a5, 5260(a2) ... 64 instructions ... 2139 0x520 ldt $f1, 256(sp) 0 0x524 ldah at, -8195(gp) 7 0x528 ldt $f30, -1016(ra) 16 0x52c lds $f9, 19412(at) 1259 0x530 ldt $f25, 8(t12) 0 0x534 mult $f1,$f26,$f26 0 0x538 addt $f28,$f9,$f28 10 0x53c ldt $f22, 0(t12) 3577 0x540 mult $f1,$f14,$f14
ProfileMe Data retires delay cycles PC (count) (avg) (count) 384 0.89 476 0x400 lds $f9, 19412(at) 370 13.24 1 0x404 stt $f1, 256(sp) 397 0.00 0 0x408 s4addl a5, 0x1, a5 365 0.01 1 0x40c stl a5, 5260(a2) ... 64 instructions ... 367 0.01 2139 0x520 ldt $f1, 256(sp) 410 0.00 0 0x524 ldah at, -8195(gp) 405 0.00 7 0x528 ldt $f30, -1016(ra) 407 0.04 16 0x52c lds $f9, 19412(at) 413 0.00 1259 0x530 ldt $f25, 8(t12) 361 0.26 0 0x534 mult $f1,$f26,$f26 429 0.25 0 0x538 addt $f28,$f9,$f28 403 0.76 10 0x53c ldt $f22, 0(t12) 422 0.00 3577 0x540 mult $f1,$f14,$f14
Good ILP in OpenGL retires delay PC 2563 0xed0 lds $f14, 13052(a0) 2515 0xed4 addq t11, s4, t11 2519 0xed8 adds $f1,$f15,$f1 2577 1.0 0xedc muls $f17,$f3,$f17 2485 0xee0 ldq_u zero, 0(sp) 2490 2.0 0xee4 subs $f19,$f20,$f20 2525 0xee8 muls $f18,$f4,$f18 2546 0xeec muls $f27,$f4,$f3 2546 0xef0 adds $f0,$f10,$f0 2501 0xef4 lds $f15, 13072(a0) 2498 0xef8 lds $f10, 13060(a0) 2521 0xefc muls $f13,$f4,$f13 2456 0xf00 adds $f16,$f11,$f16 2440 0xf04 adds $f17,$f12,$f17 2579 0xf08 ldq_u zero, 0(sp) 2502 1.0 0xf0c lds $f12, 13068(a0) 16 instructions in 4 cycles
Poor ILP in OpenGL retires delay PC 2262 0x210 addq t5, 0x10, t5 * 2308 0x214 cmptlt $f7,$f3,$f10 2231 0x218 subq t4, 0x1, t4 * 2285 1.0 0x21c cmptlt $f4,$f7,$f11 * 2224 0.9 0x220 cmptlt $f8,$f5,$f12 * 2227 1.0 0x224 cmptlt $f6,$f8,$f13 * 2257 1.0 0x228 cmptlt $f9,$f1,$f14 * 2390 1.0 0x22c cmptlt $f2,$f9,$f15 2265 0x230 lds $f7, 0(t5) * 2343 1.0 0x234 adds $f10,$f16,$f16 2357 0x238 lds $f8, 4(t5) * 2249 1.0 0x23c adds $f11,$f17,$f17 2309 0.1 0x240 lds $f9, 8(t5) * 2214 1.0 0x244 adds $f12,$f18,$f18 * 2292 1.0 0x248 adds $f13,$f19,$f19 * 2234 1.0 0x24c adds $f14,$f20,$f20 * 2282 1.0 0x250 adds $f15,$f21,$f21 2278 1.0 0x254 bgt t4, 0x210 12 Floating point adds in 12 cycles
Pipeline Traps • Traps (pipeline aborts) are expensive • Mispredicts, DTB misses, replays, etc. • Profiles identify • Trapping PCs • Trap Type • Aborted instructions • Current project • Deduce how many cycles were lost to traps
Profiling Traps and Aborts retires aborts traps ldstore PC 24 0 0 0 0xca8c stt $f16, 56(sp) 36 0 0 0 0xca90 addssu $f25,$f28,$f16 27 0 0 0 0xca94 ldl at, 8(a2) 26 0 0 0 0xca98 cmpule at, 0xc, at 29 0 0 0 0xca9c bne at, 0xdcb0 21 0 0 0 0xcaa0 stt $f20, 72(sp) 17 23 23 23 0xcaa4 ldt $f20, 56(sp) 29 28 0 0 0xcaa8 sts $f20, 60(a2) 39 20 0 0 0xcaac ldl at, 8(a2) 21 21 0 0 0xcab0 cmpule at, 0x4, at 21 26 0 0 0xcab4 bne at, 0xdcb4 20 29 8 7 0xcab8 ldt $f20, 72(sp) 31 37 0 0 0xcabc sts $f20, 28(a2) 28 33 0 0 0xcac0 ldl at, 8(a2) Trap shadow is 70 instructions long! Fixed with better register allocation
Status • ProfileMe works on Alpha 21264a • Initial experience • 17% speedup for a Java Virtual Machine • Good feedback from beta users • Still working on enhancements • Analysis software for Alpha 21264a • To appear in DCPI • Profiling hardware on future Alphas
Related Work • PC sampling: Morph, prof, … • No instruction-level information • Old Performance Counters: e.g., SGI Speedshop • Inaccurate instruction-level information • Ignores skew or smear • Simulation: Intel VTune, SimOS, … • Slow
Summary • Instruction-level information can lead to significant speedups • ProfileMe: Sample instructions rather than events • Event sampling inaccurate on O-O-O machines • Direct observation eliminates misattribution • ProfileMe first implemented in Alpha 21264a • Has led to significant insight and improvements
Research Harder questions www.research.compaq.com