Download

1 / 25
320 likes | 614 Views
Introduction to X-Ray Powder Diffraction Data Analysis. Scott A Speakman, Ph.D. Center for Materials Science and Engineering at MIT speakman@mit.edu http://prism.mit.edu/xray. 10000. Intensity ( Counts). 5000. 0. 35. 40. 45. 50. 55. Position [°2Theta] (Cu K-alpha).

E N D
Introduction toX-Ray Powder DiffractionData Analysis Scott A Speakman, Ph.D. Center for Materials Science and Engineering at MIT speakman@mit.edu http://prism.mit.edu/xray
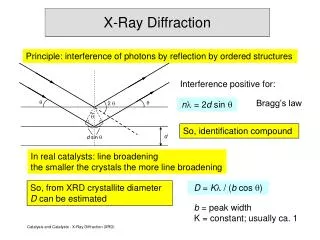
10000 Intensity (Counts) 5000 0 35 40 45 50 55 Position [°2Theta] (Cu K-alpha) An X-ray diffraction pattern is a plot of the intensity of X-rays scattered at different angles by a sample • The detector moves in a circle around the sample • The detector position is recorded as the angle 2theta (2θ) • The detector records the number of X-rays observed at each angle 2θ • The X-ray intensity is usually recorded as “counts” or as “counts per second” • To keep the X-ray beam properly focused, the sample will also rotate. • On some instruments, the X-ray tube may rotate instead of the sample. X-ray tube Detector w 2q sample Scott A Speakman, Ph.D. speakman@mit.edu
Quartz Cristobalite Glass 15 20 25 30 35 40 Position [°2Theta] (Cu K-alpha) Each “phase” produces a unique diffraction pattern • A phase is a specific chemistry and atomic arrangement. • Quartz, cristobalite, and glass are all different phases of SiO2 • They are chemically identical, but the atoms are arranged differently. • As shown, the X-ray diffraction pattern is distinct for each different phase. • Amorphous materials, like glass, do not produce sharp diffraction peaks. The X-ray diffraction pattern is a fingerprint that lets you figure out what is in your sample. Scott A Speakman, Ph.D. speakman@mit.edu
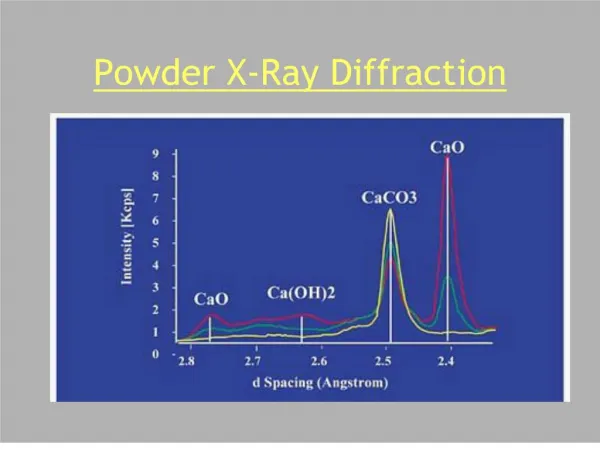
Mixture Quartz Cristobalite 0 15 20 25 30 35 40 Position [°2Theta] (Copper (Cu)) Glass 15 20 25 30 35 40 Position [°2Theta] (Cu K-alpha) The diffraction pattern of a mixture is a simple sum of the diffraction patterns of each individual phase. • From the XRD pattern you can determine: • What crystalline phases are in a mixture • How much of each crystalline phase is in the mixture (quantitative phase analysis, QPA, is covered in another tutorial) • If any amorphous material is present in the mixture Scott A Speakman, Ph.D. speakman@mit.edu
Qualitative Analysis of XRD Data Scott A Speakman, Ph.D. speakman@mit.edu
Experimental XRD data are compared to reference patterns to determine what phases are present • The reference patterns are represented by sticks • The position and intensity of the reference sticks should match the data • A small amount of mismatch in peak position and intensity is acceptable experimental error Scott A Speakman, Ph.D. speakman@mit.edu
Specimen Displacement Error will cause a small amount of error in peak positions • Specimen displacement is a systematic peak position error due to misalignment of the sample. • The direction and amount of peak shift will vary as Peaks that are close together should be shifted the same direction and by the same amount The peak shift follows a cosθ behavior, so peak shift might change direction over a large angular range Scott A Speakman, Ph.D. speakman@mit.edu
Most diffraction data contain K-alpha1 and K-alpha2 peak doublets rather than just single peaks K-alpha1 • The k-alpha1 and k-alpha2 peak doublets are further apart at higher angles 2theta • The k-alpha1 peaks always as twice the intensity of the k-alpha2 • At low angles 2theta, you might not observe a distinct second peak K-alpha1 K-alpha2 K-alpha2 K-alpha1 K-alpha2 Scott A Speakman, Ph.D. speakman@mit.edu
The experimental data should contain all major peaks listed in the reference pattern Minor reference peaks could be lost in the background noise, so it may be acceptable if they are not observed If a major reference peak is not observed in the data, then that is not a good match This is an example of a bad match between the data and the reference pattern Scott A Speakman, Ph.D. speakman@mit.edu
The X-ray diffraction pattern is a sum of the diffraction patterns produced by each phase in a mixture Each different phase produces a different combination of peaks. Scott A Speakman, Ph.D. speakman@mit.edu
You cannot guess the relative amounts of phases based upon the relative intensities of the diffraction peaks • The pattern shown above contains equal amounts of TiO2 and Al2O3 • The TiO2 pattern is more intense because TiO2 diffracts X-rays more efficiently With proper calibration, you can calculate the amount of each phase present in the sample Scott A Speakman, Ph.D. speakman@mit.edu
Diffraction peak broadening may contain information about the sample microstructure • Peak broadening may indicate: • Smaller crystallite size in nanocrystalline materials • More stacking faults, microstrain, and other defects in the crystal structure • An inhomogeneous composition in a solid solution or alloy • However, different instrument configurations can change the peak width, too These patterns show the difference between the exact same sample run on two different instruments. These patterns show the difference between bulk ceria (blue) and nanocrystalline ceria (red) When evaluating peak broadening, the instrument profile must be considered. Scott A Speakman, Ph.D. speakman@mit.edu
Quantitative Analysis of XRD Data Scott A Speakman, Ph.D. speakman@mit.edu
Diffraction peak positions can be used to calculated unit cell dimensions 25.321 deg d= 3.5145 Å 24.179 deg d= 3.6779 Å • The unit cell dimensions can be correlated to interatomic distances • Anything the changes interatomic distances- temperature, subsitutional doping, stress- will be reflected by a change in peak positions Scott A Speakman, Ph.D. speakman@mit.edu
To calculate unit cell lattice parameters from the diffraction peak positions • Convert the observed peak positions, °2theta, into dhkl values using Bragg’s Law: • Determine the Miller indices (hkl) of the diffraction peaks from the published reference pattern • If you do not have access to a reference pattern that identifies (hkl) then you will need to index the pattern to determine the (hkl) • Use the d*2 equation to calculate the lattice parameters • Most analysis programs contain an unit cell refinement algorithm for numerically solving the lattice parameters • These programs can also calculate and correct for peak position error due to specimen displacement Scott A Speakman, Ph.D. speakman@mit.edu
The diffraction peak width may contain microstructural information Width=0.007 rad XS ~ 19 nm Width=0.002 rad XS> 90 nm Size • Nanocrystallite size will produce peak broadening that can be quantified • Once the crystallite size is larger than a maximum limit, the peak broadening cannot be quantified. This creates an upper limit to the crystallite size that can be calculated. • The upper limit depends on the resolution of the diffractometer. • Non-uniform lattice strain and defects will also cause peak broadening • Careful evaluation is required to separate all of the different potential causes of peak broadening Scott A Speakman, Ph.D. speakman@mit.edu
The weight fraction of each phase can be calculated if the calibration constant is known • The calibration constants can be determined: • By empirical measurements from known standards • By calculating them from published reference intensity ratio (RIR) values • By calculating them with Rietveld refinement Scott A Speakman, Ph.D. speakman@mit.edu
All calculations are more accurate if you use more peaks over a longer angular range • If you use one or two peaks, you must assume: • That there is no specimen displacement error when calculating lattice parameters • That there is no microstrain broadening when calculating crystallite size • If you use many peaks over a long angular range (for example, 7+ peaks over a 60° 2theta range), you can: • Calculate and correct for specimen displacement when solving lattice parameters • Calculate and account for microstrain broadening when calculating crystallite size • Improve precision by one or two orders of magnitude Scott A Speakman, Ph.D. speakman@mit.edu
There are different ways to extract peak information for quantitative analysis • Numerical methods reduce the diffraction data to a list of discrete diffraction peaks • The peak list records the position, intensity, width and shape of each diffraction peak • Calculations must be executed based on the peak list to produce information about the sample • Full pattern fitting methods refine a model of the sample • A diffraction pattern is calculated from a model • The calculated and experimental diffraction patterns are compared • The model is refined until the differences between the observed and calculated patterns are minimized. • The Rietveld, LeBail, and Pawley fitting methods use different models to produce the calculated pattern Scott A Speakman, Ph.D. speakman@mit.edu
A peak list for empirical analysis can be generated in different ways • The diffraction data are reduced to a list of diffraction peaks • Peak search • Analysis of the second derivative of diffraction data is used to identify likely diffraction peaks • Peak information is extracted by fitting a parabola around a minimum in the second derivative • This method is fast but the peak information lacks precision • Profile fitting • Each diffraction peak is fit independently with an equation • The sum of the profile fits recreates the experimental data • Peak information is extracted from the profile fit equation • This method provides the most precise peak information Scott A Speakman, Ph.D. speakman@mit.edu
Intensity (a.u.) 28.5 29.0 29.5 30.0 2 q (deg.) Profile Fitting produces precise peak positions, widths, heights, and areas with statistically valid estimates • Empirically fit experimental data with a series of equations • fit the diffraction peak using the profile function • The profile function models the mixture of Gaussian and Lorentzian shapes that are typical of diffraction data • fit background, usually as a polynomial function • this helps to separate intensity in peak tails from background • To extract information, operate explicitly on the equation rather than numerically on the raw data Scott A Speakman, Ph.D. speakman@mit.edu
Diffraction peak lists are best reported using dhkl and relative intensity rather than 2q and absolute intensity. • The peak position as 2q depends on instrumental characteristics such as wavelength. • The peak position as dhkl is an intrinsic, instrument-independent, material property. • Bragg’s Law is used to convert observed 2q positions to dhkl. • The absolute intensity, i.e. the number of X rays observed in a given peak, can vary due to instrumental and experimental parameters. • The relative intensities of the diffraction peaks should be instrument independent. • To calculate relative intensity, divide the absolute intensity of every peak by the absolute intensity of the most intense peak, and then convert to a percentage. The most intense peak of a phase is therefore always called the “100% peak”. • Peak areas are much more reliable than peak heights as a measure of intensity. Scott A Speakman, Ph.D. speakman@mit.edu
Calculations must be executed on the peak list to yield any information about the sample • This peak list itself does not tell you anything about the sample • Additional analysis must be done on the peak list to extract information • From the peak list you can determine: • Phase composition: by comparison to a database of reference patterns • Semi-quantitative phase composition: calculated from peak intensities for different phases • Unit cell lattice parameters: calculated from peak positions • Crystal system: determined by indexing observed peaks and systematic absences • Crystallite size and microstrain: calculated from peak widths and/or shapes • A number of engineering indexes are also calculated from peak list information Scott A Speakman, Ph.D. speakman@mit.edu
Full pattern fitting methods use different models to produce a calculated pattern • The Rietveld method uses fundamental calculations from crystal structure models to produce the calculated diffraction pattern • Analysis produces a refined crystal structure model for all phases in the sample • Peak positions and intensities are constrained by the crystal structure model • Crystallite size, microstrain, and preferred orientation can be extracted from empirical models included in the refinement • Le-Bail and Pawley fitting methods use unit cell models combined with empirical fitting of peak intensities • Analysis produces a refined unit cell model but does not immediate yield information about parameters related to peak intensities Scott A Speakman, Ph.D. speakman@mit.edu
Other analytical methods • Total scattering methods (whole pattern fitting) attempts to model the entire diffraction pattern from first principal calculations • Calculations include • Bragg diffraction peaks, • diffuse scatter contributions to background, • peak shapes based on diffractometer optics, • peak shapes based on crystallite size, shape, defects, and microstrain • Pair distribution functional analysis uses Fourier analysis to produce an atomic pair density map • Can yield atomic structure information about non-crystalline, semi-crystalline, and highly disordered materials Scott A Speakman, Ph.D. speakman@mit.edu