Download
1 / 41
410 likes | 546 Views
Modelling infectious agents in food webs. Hans Heesterbeek. Small selection of examples from Selakovic , de Ruiter & H, submitted review. It would be hard to study the ecology of a natural system without this being influenced by infectious agents

E N D
Modelling infectious agents in food webs Hans Heesterbeek
Small selection of examples from Selakovic, de Ruiter & H, submitted review
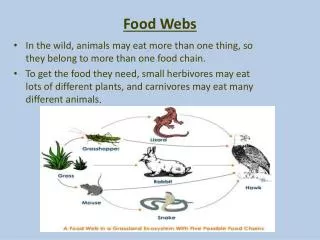
It would be hard to study the ecology of a natural system without this being influenced by infectious agents • Only in recent decades have we started to explore these explicitly • Theory to think about these influences is lagging behind
Changes in the Serengeti ecosystem: increased tree cover since 1980’s Picture collage: Ricardo Holdo Photo’s: John Fryxell
Serengeti ecosystem & rinderpest Cascade: rinderpest disappears tree density increases in the ecosystem Via “the effect of rinderpest on a herbivore that does not even consume trees” (Holdo et al) Holdo et al. PLoS Biology, 2009, 7(9), e1000210
Unhealthy herd effect Daphnia Predator produces chemical that induces larger body size in its prey, Daphnia. Larger Daphnia are more susceptible to a fungal parasite because of their increased feeding rate Larger infected Daphnia produce more fungal spores Chaoborus Body size and spore yield of Daphnia in presence of chemical compared to absence Pictures and example from Duffy et al., Functional Ecol., 2011 Work of Spencer Hall/Meghan Duffy
Dynamics lion population ’75-’05 Red bars: outbreaks of CDV with massive lion mortality 1994, 2001 Grey bars: ‘silent’ outbreaks of CDV detected by serology (retrosp.) C,D: number of buffalo carcasses in lion diet Extensive herbivore deaths after extreme drought in 1993 (S) and 2000 (N) From: Munson et al, 2008, PLoS One
Nematomorph parasites in crickets(community) Sato et al., Ecol. Lett. 2012
Savanah ecosystem of Kruger National Park, SA From: Han Olff et al. Phil. Trans. R. Soc. B 2009;364:1755-1779
Infectiousagents are species Pred. Pred. Para- site 1 Patho-gen 2 Prey Prey Suggests effects on topology, connectivity, path length, ‘complexity’
Kevin Lafferty Salt marsh food web Yellow = parasite species Red = host species PNAS, 2008, Ecol. Lett, 2008 Arctic food web Beckerman & Petchey J. Anim. Ecol. 2009
Pelagic food web of sub-arctic lake Takvatn with only predator-prey interaction (top) and including parasite species and their links (bottom) Amundsen et al J. Anim Ecol. 2009
US-Army General: “it’s dangerous because it creates the illusion of understanding” (New York Times)
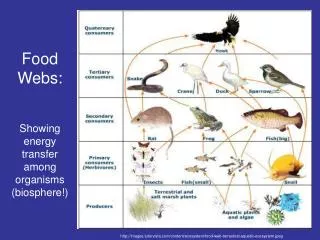
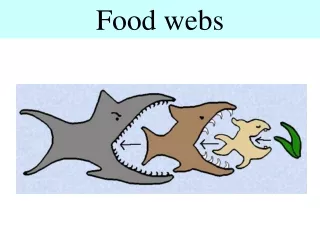
Three approaches to food webs • Possible ways to think about infectious agents in food web; I is “pathogen”; II is “parasite”
Two approaches to infectious agents in food webs • Direct approach: agent as separate species/node • Indirect approach: agent only through its effect in splitting host species split into epidemiological (infected) states
Phytophagous Nematodes Collembolans Predaceous Mites Cryptostigmatic Roots Mites Predaceous Noncrypto- Collembolans Saprophytic stigmatic Mites Fungi Nematode Fungivorous Feeding Mites Nematodes Predaceous Nematodes Enchytraeids Detritus Bacteriophagous Nematodes Flagellates Bacteria Amoebae Bacteriophagous Mites Energy flow soil food web Measurements of feeding, energy flow, biomass, interaction strength picture: Peter de Ruiter
Distribution of interaction strengths and biomass within a food web maintains stability with increasing complexity top predators consumer resource predatory collembola predatory mites nematophagous mites predatory mites predatory nematodes predatory mites predatory nematodes predatory collembola collembola predatory mites cryptostigmatic mites predatory mites non-cryptostigmatic mites predatory mites fungivorous nematodes predatory mites bacteriophagous nematodes predatory mites bacteriophagous mites predatory mites predatory nematodes nematophagous mites fungivorous nematodes predatory collembola bacteriophagous nematodes predatory collembola fungivorous nematodes nematophagous mites bacteriophagous nematodes nematophagous mites phytophagous nematodes predatory mites amoebae predatory nematodes fungivorous nematodes predatory nematodes flagellates predatory nematodes bacteriophagous nematodes predatory nematodes phytophagous nematodes predatory collembola phytophagous nematodes nematophagous mites flagellates amoebae phytophagous nematodes predatory nematodes bacteria predatory nematodes bacteria amoebae fungi collembola fungi cryptostimatic mites fungi non-cryptostigmatic mites fungi fungivorous nematodes bacteria flagellates bacteria bacteriophagous nematodes bacteria bacteriophagous mites fungi enchytraeids bacteria enchytraeids detritus enchytraeids roots phytophagous nematodes detritus fungi detritus bacteria basal resources A.M. Neutel, et al., Science (2002) & Nature (2007) How do infectious agents influence this? Theory based on steady state situation of biomass distribution over species: “only” the ecological questions can be studied
1 2 4 5 6 7 8 9 3 -0.085 0.021 0.021 0.021 0.021 0.021 1 -1.5 -0.085 0.015 0.015 0.015 0.015 0.015 2 -1.5 -0.15 -0.085 0.017 0.017 0.017 0.017 0.017 3 -2.8 -0.29 -0.32 -0.085 0.019 0.019 0.019 0.019 0.019 4 -2.8 -0.28 -0.32 -0.19 -0.085 0.022 0.022 0.022 0.022 5 -1.4 -0.14 -0.16 -0.093 -0.11 -0.085 0.024 0.024 6 -0.16 -0.093 -0.11 -0.24 -0.085 0.023 7 -11 -13 -7.5 -8.5 -0.085 8 -7.5 -8.5 -19 -18 -0.085 9 basal species Top species real Effects of prey on their predator Effects of predators on their prey Self-limiting effects (diagonal) basal species
Direct approach: challenges • Infectious agent as a species, with links to host species • Is an agent-host link “the same” as a predator-prey link in a topological analysis? • Agent consumes part of resource, but even when agent kills host, this host is still available as prey for predators. So how to account for this? • Some parasite stages and most pathogens inside host • How to make this precise before studying effects on path lengths, complexity, nr. of trophic levels, … ? • Much of the current theory restricted to systems in steady state (e.g. with respect to biomass distribution)
Intermediate view Predator • Structure host species by epidemiological state • Incorporate effects through interaction strengths • Study food-web dynamics with “weighted” interaction strength driven by changes in distribution over epi-states Recov. Pred. Susc. Pred. InfectPred. Prey
Intermediate approach: challenges • Similarities to network models on which infection spreads: • Network is known and fixed • But: it is the dynamic strength of the link that describes the system • This strength changes depending on within-species dynamics of infectious agent in the species involved in the link • The strength itself influences the between-species dynamics • How to model (let alone analyse) this feed back?
Indirectapproach • More pragmatic and close to the ecological and epidemiological modelling we know • Basically: take a predator-prey model and add allow different infected states for each host species
Developments in math. biology • Hadeler & Freedman, 1989: parasite mediates coexistence between predator and prey • Chattopadhyay & Arino, 1999: similar with disease in prey, probably coined “eco-epidemiology” • Venturino, 1994, 1995, 2002: Lotka-Volterra with infection • Han & Hethcote, 2001: one predator/one prey with infection • Hsieh & Hsiao, 2008: similar • Haque & Venturino, 2006: similar • Han & Pugliese, 2009: similar • Malchow and others 2005-2008 (papers + book): spatial predator-prey with infection • Hilker and others, 2006-2010 (5 papers): Allee effect and infection, stabilizing predator-prey oscillations, bio-control • Morozov, 2012: one predator/ one prey and infection
Pathogen can mediate coexistence between consumer and resource when feeding rate too high
Consumer-resource dynamics • n species, population sizes Ni • Pi set of consumers species for which species i is a resource • Consumption rate ΦijNj • Positive effect on species j: ejiΦji Ni • Qi set of species that are consumed by species i • Density dependent birth and death From: Roberts & Heesterbeek, J. Math. Biol. March 2013
Ecological stability • Steady state solutions • Jacobianmatrix C, community matrix:
Stability in combined system • Jacobianmatrix J is, for a particular steady state, given by • Order by total population sizes Ni, followed by the sizes of all infected states in the system • Cis the communitymatrix, as given before • H is the epidemiologicalmatrix; this matrix is related to the next-generation matrix (NGM)
D gives influence of changes in the ecologyof individuals due to epidemiology (i.e. their infected state) • E.g. changes in feeding behaviour, fecundity, … • B gives the influence of changes in the epidemiologyof infected individuals due to ecology (e.g. population size Ni) • E.g. changes in the influence of density dependence for infected individuals, compared to uninfected • In the infection-free steady state (invasion problem), matrix B = 0, the zero matrix • For endemic states, B is typically not the zero matrix
Stability: spectral bound of J • Regard J for the infection-free steady state: • Consequence: B = O = zero matrix • Stability problem decouples in product of ecological stability (governed by C) x epidemiological stability (governed by H) • H describes the influence of any infected state on each infected state • H = T + Σ • T the transmission matrix, Σ the transition matrix • Next-generation matrix with large domain: In SI-example: KL = K, next-gen. matrix; in all cases: R0 = spectral radius of KL
Epidemiological stability H = T + Σfor pred.-prey with infection in both Epidemiological stability depends on feeding rate ϕ
Wildebeest-grass-rinderpest H is a 1 x 1 ‘matrix’ (only one infected state) R0 = β/(μ2 + α) Epidemiological stability does not depend on ϕ in this example
Stability is balance between ecologyand epidemiology Consumer extinct due to infection
Serengeti ecosystem & rinderpest Rinderpest regulated wildebeest to a low steady state level Vaccination of cattle around the park lowered infection success in wildebeest R0 decreased to below 1 Wildebeest settled in high steady state; grass in low state Data from Holdo et al. PLoS Biology, 2009, 7(9), e1000210 Afterthought: more tree and shrub cover could lead to increase of tsetse flies which could lead to more sleeping sickness in cattle and humans
Eco-epi approach: agenda • Deriving useful analytical results for the stability of non-trivial states (B not equal zero matrix) • What happens in periodic environments? • Stability related to adding one host or non-host species? Exploring the dilution effect (Pete’s lecture!) • How is overall system stability related to relevant indicators related to matrix C, D, B, H • Parasites with ilife stages (Andy’s question and conjecture: hope to deal with that in the coming weeks)
Summary • On your wish list of future extensions for your work: add multiple species and community dynamics!
The web of interactions between microparasite species within a community of infectious agents in one rodent host species (bank vole), showing the magnitude of effects. Sandra Telferet al. Science 2010;330:243-246
How and what to model? • Within host: using ideas from metabolic/gene regulatory networks? Relevant questions? Relevant experiments or empirical set ups? • Individual level: how is susceptibility and infectivity for agent A mediated by agents B, C, D, …? Does influence remain when an agent has been cleared? Immune response. • Population level: how does dynamics of agents B, C, D, … and their distribution over the host species influence the invasion and spread of A into that community? • How to model the above? Stratify by history of infection?