Download
1 / 58
590 likes | 776 Views
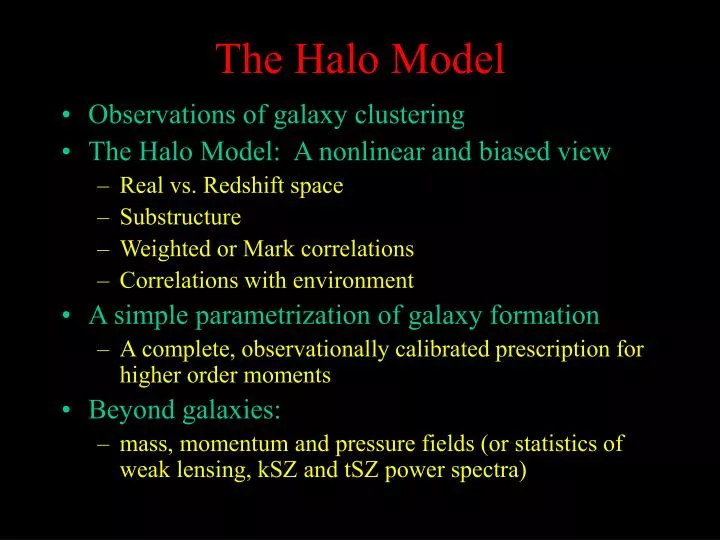
The Halo Model. Observations of galaxy clustering The Halo Model: A nonlinear and biased view Real vs. Redshift space Substructure Weighted or Mark correlations Correlations with environment A simple parametrization of galaxy formation

E N D
The Halo Model • Observations of galaxy clustering • The Halo Model: A nonlinear and biased view • Real vs. Redshift space • Substructure • Weighted or Mark correlations • Correlations with environment • A simple parametrization of galaxy formation • A complete, observationally calibrated prescription for higher order moments • Beyond galaxies: • mass, momentum and pressure fields (or statistics of weak lensing, kSZ and tSZ power spectra)
Large Scale Structure • 2-point and n-point statistics • Counts in cells/void probability function • Fractal/multi-fractal behaviour • Percolation/Minimal spanning tree • Minkowski functionals • Shape statistics
Number of data pairs with separation r Number of random pairs with separation r = 1 + x(r)
Power-law: x(r) = (r0/r)g slope g = -1.8
Galaxy clustering depends on galaxy type: color, luminosity, etc. Zehavi et al. 2005 SDSS
Galaxy Clustering varies with Galaxy Type How is each galaxy population related to the underlying Mass distribution? Bias depends upon Galaxy Color and Luminosity Need large, carefully selected samples to study this (e.g. Norberg et al. 2002 2dFGRS)
Light is a biased tracer Understanding bias important for understanding mass
Gaussian fluctuations as seeds of subsequent structure formation Gaussianity simplifies mathematics: logic which follows is general
Hierarchical models Dark matter ‘haloes’ are basic building blocks of ‘nonlinear’structure Models of halo formation suggest haloes have same density whatever their mass (Gunn & Gott 1974) Springel et al. 2005
Cold Dark Matter • Cold: speeds are non-relativistic • To illustrate, 1000 km/s ×10Gyr ≈ 10Mpc; from z~1000 to present, nothing (except photons!) travels more than ~ 10Mpc • Dark: no idea (yet) when/where the stars light-up • Matter: gravity the dominant interaction
Initial spatial distribution within patch (at z~1000)... …stochastic (initial conditions Gaussian random field); study `forest’ of merger history ‘trees’. …encodes information about subsequent ‘merger history’ of object (Mo & White 1996; Sheth 1996)
Galaxy formation • Gas cools in virialized dark matter ‘halos’. Physics of halos is nonlinear, but primarily gravitational. • Complicated gastrophysics (star formation, supernovae enrichment, etc.) mainly determined by local environment (i.e., by parent halo), not by surrounding halos.
How to describe different point processes which are all built from the same underlying distribution?
Center-satellite process requires knowledge of how • halo abundance; 2) halo clustering; 3) halo profiles; • 4) number of galaxies per halo; all depend on halo mass. • (Revived, then discarded in 1970s by Peebles, McClelland & Silk)
(Reed et al. 2003) The Halo Mass Function • Small halos collapse/virialize first • Can also model halo spatial distribution • Massive halos more strongly clustered Sheth & Tormen 1999; Jenkins et al. 2001; Warren et al. 2006
Still the best connection between the Excursion Set model and the Peaks model (making this airtight is a nice open problem)
Most massive halos populate densest regions over-dense under-dense Key to understand galaxy biasing (Mo & White 1996; Sheth & Tormen 2002) n(m|d) = [1 + b(m)d] n(m) ≠ [1 + d] n(m)
Massive halos more strongly clustered‘linear’ bias factor on large scales increases monotonically with halo mass Hamana et al. 2002
Theory predicts… • Can rescale halo abundances to ‘universal’ form, independent of P(k), z, cosmology • Greatly simplifies likelihood analyses • Intimate connection between abundance and clustering of dark halos (Sheth & Tormen 1999) • Can use cluster clustering as check that cluster mass-observable relation correctly calibrated • Important to test if these fortunate simplifications also hold at 1% precision
Halo Profiles Navarro, Frenk & White (1996) • Not quite isothermal • Depend on halo mass, formation time; massive halos less concentrated • Distribution of shapes (axis-ratios) known (Jing & Suto 2001)
The halo-model of clustering • Two types of pairs: both particles in same halo, or particles in different halos • ξdm(r) =ξ1h(r) + ξ2h(r) • All physics can be decomposed similarly: ‘nonlinear’ effects from within halo, ‘linear’ from outside
Halo Model is simplistic … • Nonlinear physics on small scales from virial theorem • Linear perturbation theory on scales larger than virial radius (exploits 20 years of hard work between 1970-1990) …but quite accurate!
The halo-model of galaxy clustering • Again, write in terms of two components • ξ1gal(r) ~∫dm n(m) g2(m)ξdm(m|r)/rgal2 • ξ2gal(r) ≈ [∫dm n(m)g1(m)b(m)/rgal]2 ξdm(r) • rgal = ∫dm n(m) g1 (m): number density of galaxies • ξdm(m|r): fraction of pairs in m-halos at separation r • Think of number of galaxies, g1(m), as a weight applied to each dark matter halo - galaxies ‘biased’ if g1(m) not proportional to m (Jing, Mo & Boerner 1998; Benson et al. 2000; Peacock & Smith 2000; Seljak 2000; Scoccimarro et al. 2001)
Type-dependent clustering: Why? populate massive halos populate lower mass halos Sheth & Diaferio 2001 Spatial distribution within halos second order effect (on >100 kpc)
Comparison with simulations Sheth et al. 2001 • Halo model calculation of x(r) • Red galaxies • Dark matter • Blue galaxies • Note inflection at scale of transition from 1halo term to 2-halo term • Bias constant at large r x1h›x2h x1h‹x2h →
Similarly … • Model clustering of thermal SZ effect as a weight proportional to pressure, applied to halos/clusters • Model clustering of kinetic SZ signal as a weight, proportional to halo/cluster momentum • Model weak gravitational galaxy-galaxy lensing as cross-correlation between galaxies and mass in halos • (see review articleCooray & Sheth 2002)
Satellite galaxy counts ~ Poisson • Write g1(m) ≡ ‹g(m)› = 1 + ‹gs(m)› • Think of ‹gs(m)› as mean number of satellite galaxies per m halo • Minimal model sets number of satellites as simple as possible ~ Poisson: • So g2(m) ≡ ‹g(g-1)› = ‹gs (1+gs)› = ‹gs› + ‹gs2› = 2‹gs› + ‹gs›2 = (1+‹gs›)2 - 1 • Simulations show this ‘sub-Poisson’ model works well (Kravtsov et al. 2004)
Luminosity dependent clustering Zehavi et al. 2005 SDSS • Deviation from power-law statistically significant • Centre plus Poisson satellite model (two free parameters) provides good description
Two approaches • Halo Occupation Distribution (Jing et al., Benson et al.; Seljak; Scoccimarro et al.) • Model Ngal(>L|Mhalo) for range of L (Zehavi et al.; Zheng et al.; Berlind et al.; Kravtsov et al.; Conroy et al.; Porciani, Magliochetti; Collister, Lahav) • Differentiating gives LF as function of Mhalo (Tinker et al., Skibba et al.): • Conditional Luminosity Function (Peacock, Smith): • Model LF as function of Mhalo , and infer HOD (Yang, Mo, van den Bosch; Cooray)
Why is … • Luminosity dependence of SDSS clustering well described by halo model with g1(m|L) ≈ 1 + m/[23 m1(L)] • g1(m|L) nonzero only if m>m1, where m1(L) adjusted to match decrease of number density with increasing L • (Assume Poisson distribution, with mean g1, for non-central, ‘satellite’ galaxies)
Number density and clustering as function of luminosity now measured in 2dF,SDSS • Assuming there are NO large scale environmental effects, halo model provides estimates of luminosity distribution as function of halo mass (interesting, relatively unexplored connection to cluster LFs) • Suggests BCGs are special population(another interesting, unexplored connection to clusters!)
Predicted correlation between luminosity and mass total satellite central <Lcen|M> ~ ln(1 + M/Mcrit) Prediction based on halo-model interpretation of clustering in SDSS for galaxy samples with various L cuts (Zehavi et al. 2005) <Lsat|M> ~ independent of M Skibba, Sheth, Connolly, Scranton 2006
Halo model fits of Zehavi et al. (SDSS) imply mean satellite luminosity only weak function of halo mass Provides good description of group catalog of Berlind et al. (SDSS) Worth reconsidering Scott (1957) effect, but for satellites?
BCG LF: Peebles; Tremaine & Richstone; Bhavsar & Barrow; Lauer & Postman
Halos and Fingers-of-God • Virial equilibrium: • V2 = GM/r = GM/(3M/4p200r)1/3 • Since halos have same density, massive halos have larger random internal velocities: V2 ~ M2/3 • V2 = GM/r = (G/H2) (M/r3) (Hr)2 = (8pG/3H2) (3M/4pr3) (Hr)2/2 = 200 r/rc (Hr)2/2 = W (10 Hr)2 • Halos should appear ~ten times longer along line of sight than perpendicular to it: ‘Fingers-of-God’ • Think of V2 as Temperature; then Pressure ~ V2r
Two contributions to velocities ~ mass1/3 • Virial motions (i.e., nonlinear theory terms) dominate for particles in massive halos • Halo motions (linear theory) dominate for particles in low mass halos Growth rate of halo motions ~ consistent with linear theory
Higher order moments • In centre + Poisson satellite model, these are all completely specified • On large scales, higher order moments come from suitably weighting perturbation theory results • Incorporating halo shapes matters on small scales (Smith, Watts & Sheth 2006)
Three-point statistics Wang et al. 2004 Equilateral triangles in the dark matter distribution…
…and for galaxies……in real space… Wang et al. 2004
…and in redshift space Wang et al. 2004
…as well as dependence on configuration and on luminosity and on color Wang et al. 2004
Halo Substructure = Galaxies • Halo substructure = galaxies is good model (Klypin et al. 1999; Kravtsov et al. 2005) • Agrees with semi-analytic models and SPH (Berlind et al. 2004; Zheng et al. 2005; Croton et al. 2006) • Setting n(>L) = n(>Vcirc) works well for all clustering analyses to date, including z~3(Conroy et al. 2006)
Wrong subclump model won’t work Change in power due to substructure; model by Sheth & Jain (2003) Hagan et al 2005
Weighted correlations or mark statistics:There’s more to the points
Luminosity as mark in SDSS Large scale signal consistent with halo bias prediction; no large scale environmental trends Small scale signal suggests centre special; model with gradual threshold (rather than step) is better Unweighted signal centre not special centre special Skibba, Sheth, Connolly, Scranton 2006
Environmental effects • Gastrophysics determined by formation history of parent halo • Formation history correlates primarily with mass (massive objects form later) • Current halo model implementations implicitly assume that all environmental trends come from fact that massive halos populate densest regions