Download
1 / 24
240 likes | 327 Views
Customize Your Information Using the New State Data Center. March 2010. Click here to access the new Data Center. Click here to begin customizing your data. Click here to customize your own table. Select up to 10 indicators to generate a table, then click here to continue.

E N D
Customize Your InformationUsing the New State Data Center March 2010
Select up to 10 indicators to generate a table, then click here to continue
Click here to choose all 50 states plus the U.S. national comparison… Then click here to continue …or choose only a few states to compare
Click here to download the data into Excel, or to create a printer-friendly version
You can also select policy indicators to generate a table, then click here to continue
Click here to choose all 50 states plus the U.S. national comparison… Then click here to continue …or choose only a few states to compare
Click here to download the data into Excel, or to create a printer-friendly version
Then click here to continue Click here to choose all 50 states plus the U.S. national comparison… …or choose only a few states to compare
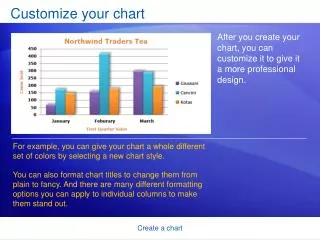
Click here to graph a trend Click here to download the data into Excel
Click here to download the data into Excel, or to save the graphic as a JPEG
Click here to download the data into Excel, or to save the graphic as a JPEG
Click here for a summary of an individual state’s data and policies Choose your state using the drop-down menu or by clicking on the map
Click here for a printer-friendly version Expand each category for more information and links to additional resources
Click Here to Get Started www.guttmacher.org/datacenter