Download

1 / 48
510 likes | 794 Views
Cohort study . What is a cohort?. One of 10 divisions of a Roman legion Group of individuals sharing same experience followed up for specified period of time Examples birth cohort cohort of guests occupational cohort of chemical plant workers. follow-up period.

E N D
What is a cohort? • One of 10 divisions of a Roman legion • Group of individuals • sharing sameexperience • followed up for specifiedperiod of time • Examples • birthcohort • cohort of guests • occupationalcohort of chemical plant workers
Calculate measure of frequency: • Cumulative incidence • Incidence proportion • Attack rate (outbreak) • Incidence density end offollow-up
Cohort studies • Purpose • Study if an exposure is associated with outcome(s)? • Estimate risk of outcome in exposed and unexposed cohort • Compare risk of outcome in two cohorts • Cohort membership • Being at risk of outcome(s) studied • Being alive and free of outcome at start of follow-up
exposed unexposed Cohort studies
Incidence among exposed Incidence amongunexposed Cohort studies exposed unexposed
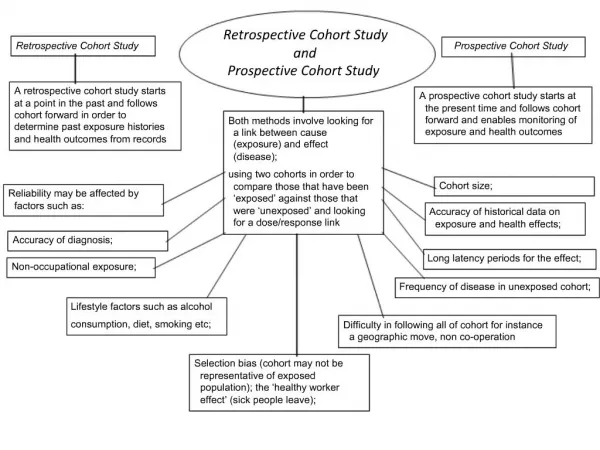
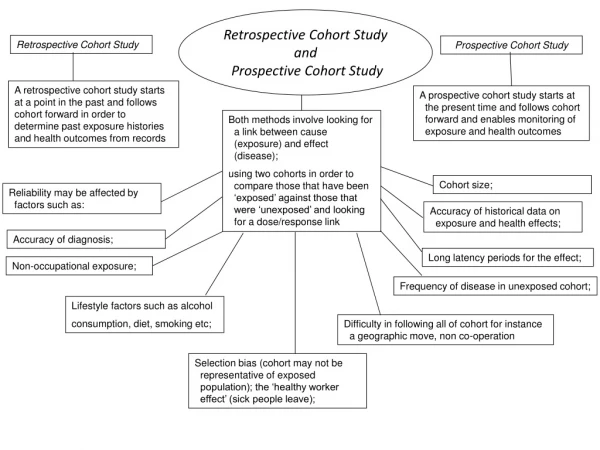
Study starts Prospective cohort study Disease occurrence Exposure time
Study starts Disease occurrence Exposure time Retrospectivecohortstudies
Study starts Disease occurrence Exposure time Case study Salmonella in Belfast
Cohort Study DZ E DZ Healthy People DZ - E DZ ++++++++++++++++++++++++++++++++++++++++++++++++++++++++++ ++++++++++++++++++++++++++++++++++++++++++++++++++++++++++ Time
Recipe: Cohort study • Identify group of • exposed subjects • unexposed subjects • Follow up for disease occurrence • Measure incidence of disease • Compare incidence between exposed and unexposed group
Study Population • Define Population at Risk using inclusion criteria • Individuals with outcome of interest at time of screening and enrollment are not eligible for study • Sub-clinical presentation of diseases may be present challenges in defining the cohort
Our objective is to compare: An incidence rate in an exposed population to the rate that would have been observed in the same population, at the same time if it had not been exposed
Prospective Cohort Study • Measures of association • Relative risk (ratio of proportions) • Odds ratio
Study Design: Prospective Cohort Study • Relation between oral contraceptive use and circulatory disease • Study design: • Identify 23,000 users and 23,000 nonusers of oral contraceptives • Follow and ascertain presence or absence of circulatory disease
Cohort Study Design • An epidemiologic design in which the incidence of a disease (or condition) is estimated and compared among exposed and unexposed individuals.
Cohort Study DesignRationale • Cohort study designs evolved because of the need for information on the length of survival and the natural history of disease • Clinical and public health interest
Cohort Study DesignHistory • Prospective cohort studies • Chronic Disease Cohorts (20th Century) • Framingham study of cardiovascular disease, 1948 • Japanese atomic bomb survivors, 1946 • British physician study, 1950s • Colorado Plateau uranium miners, 1950s • Retrospective cohort studies • Aniline-dye occupational cohort, 1954
Measuring Exposure • Measuring exposure is one of the fundamental activities of a cohort study • Exposure measurement must be comparable for all members of the cohort • Carefully defined in advance of study • Specific attention should be given to the accuracy and precision of proposed measurements • Pilot studies often needed
Determining the Exposure • Valid means of determining exposure include: • Questionnaires (e.g., age, smoking history) • Laboratory tests (e.g., cholesterol, hemoglobin) • Physical measurements (e.g., blood pressure, height) • Special procedures (e.g., electrocardiogram, x-rays) • Medical records
COHORT STUDIES • Cohort Study • Key Point: • Presence or absence of risk factor is determined before outcome occurs.
Comparison (Control) Groups for Cohort Studies • Internal controls With a one-sample (population-based) cohort, exposure is unknown until after the first period of observation Example: • Select the cohort (such as all residents of a given neighborhood) • All members of the cohort are then given first round questionnaires, and/or clinical examinations, and/or testing to determine exposure • The cohort is then divided into exposure categories based on those results
Comparison (Control) Groups for Cohort Studies (cont.) • External controls • If everyone in a cohort is exposed (such as workers in an industry), a separate cohort as similar as possible to the exposed in terms of income, education, geography, and age should be sought Example: Workers in a neighboring but unexposed industry
Comparison (Control) Groups for Cohort Studies (cont.) • Known population rates • If a comparison group cannot be assembled, known population rates of outcomes may be acceptable under some circumstances, if they are adjusted for the variables of interest • For lung cancer, however, rates are based on the population and are not adjusted for smoking • They are not, therefore, instructive to compare to populations with high smoking rates, such as miners
Outcome Definition • Primary outcome - the main event that will be related to the exposure • Failure-time outcomes • Death • Disease occurrence • Repeated measures • Secondary outcomes - other events that are of interest and may corroborate the findings of the main outcome
Cohort Study DesignTypes of Cohorts • Fixed Cohort • A group of individuals recruited and enrolled at a uniform point in the natural history of a disease or by some defining event • Cohort does not take on new members after it is assembled • Examples • Patients admitted to the ER with acute MI • Survivors of Hiroshima bombings • Children born to HIV-infected mothers
Cohort Study DesignType of Cohorts • Open cohort • A group of individuals recruited and enrolled through a mechanism that allows for in and out migration of people • Defined by characteristic other than disease, e.g., geographic location, administrative unit • Dynamic population • Examples • Framingham Study
Cohort studies • Fixed Cohort X = outcome x (+) x Exposure (-) x
Cohort studies • Dynamic X = outcome X X (+) X Exposure X (-) Years
Advantages and disadvantages
Cohort studies Advantages: The cohort study is the gold-standard of analytical epidemiology • ascertain incidence and natural history • investigation of multiple outcomes • assessment of many outcomes • Useful for rare exposures • Temporal relationship between exposure and outcome • Ascertainment bias minimized • Less subject to selection biases • outcome not known (prospective) • Can directly measure • incidence in exposed and unexposed groups • true relative risk • Can examine multiple effects for a single exposure
Cohort studies Disadvantages: • Selection bias • Loss to follow up • Requires excellent follow-up • Large sample size • Latency period • Time consuming • Inefficient for rare diseases • Expensive • Ethical considerations • Exposure can change
Cohort studies • Rate • Rate difference • Rate Ratio (strength of association) Case control studies • No calculation of rates • Proportion of exposure
Measures of Association: Prospective Cohort Study • Relative risk • Also know as risk ratio • Ratio of the proportion of cases in exposed group compare to proportion in unexposed group
Relative Risk • General interpretation of relative risk (RR) • If RR > 1 Positive association between disease and risk factor = 1 No association < 1 Negative association • The “reference group” is in the denominator • Reference group generally chosen as the “unexposed” group
Odds Ratios • The odds of a disease is defined as or equivalently:
Odds Ratios • For example, if the risk of having disease A were .20, the odds of having disease A would be .20/.80 = .25 (or 1 in 4) • Notice, the odds is not the risk but is a “function” of the risk • Just as we can compare risk via the risk ratio, we can compare odds via the odds ratio • Odds ratio is very easy to calculate from a 2 x 2 table!
Bottom line: • Only cohort studies (including clinical trials) can yield incidence and relative risk. • The odds ratio, (e.g., from a case-control study) will always be greater than the relative risk. For rare diseases, the odds ratio will be close to the relative risk.
A cohort study allows to calculate indicators which have a clear, precise meaning. The results are immediately understandable.
Presentation of cohort data: Population at risk Does HIV infection increase risk of developing TB among a population of drug users? Population Cases (f/u 2 years) HIV + 215 8 HIV - 289 1 Source: Selwyn et al., New York, 1989
Presentation of cohort data: Person-years at risk Tobacco smoking and lung cancer, England & Wales, 1951 Person-years Cases Smoke 102,600 133 Do not smoke 42,800 3 Source: Doll & Hill
Ie • Iue Effect measures in cohort studies • Absolute measures • Risk difference (RD) Ie - Iue • Relative measures • Relative risk (RR) • Rate ratio • Risk ratio Ie = incidence in exposed Iue= incidence in unexposed
Does HIV infection increase risk of developing TB among drug users?
Vaccine efficacy (VE) VE = 1 - RR = 1 - 0.28 = 72%
Cohort study: Tobacco smoking and lung cancer, England & Wales, 1951 Source: Doll & Hill