Download
1 / 16
160 likes | 282 Views
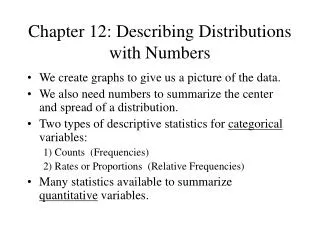
Chapter 2: Describing location in a distribution. Section 2- Normal Distributions. Normal Density Curve. Why normals ????. Offer good descriptions for some distributions of real data . Examples: Standardized test scores Repeated careful measurements of the same quantity

E N D
Chapter 2: Describing location in a distribution Section 2- Normal Distributions
Why normals???? • Offer good descriptions for some distributions of real data. • Examples: • Standardized test scores • Repeated careful measurements of the same quantity • Characteristics of biological populations • Good approximation to results of many kinds of chance outcomes • Many statistical inference procedures based on Normal distn’s work well for other roughly symmetric distn’s
68-95-99.7 Rule • In the Normal distribution with mean µ and standard deviation σ • Appx 68% of the observations fall within σ of the mean µ • Appx 95% of the observations fall within 2σ of the mean µ • Appx 99.7% of the observations fall within 3σ of the mean µ • c
Try it out…… • The distribution heights of young women aged 18-24 is approximately Normal with mean µ=64.5 inches, and standard deviation σ=2.5 inches. Write the graph to depict the 68-95-99.7 rule.
Normal Distribution Notation • Using mean µ and standard deviation σ we abbreviate Normal distributions as: N(µ, σ) • How could we abbreviate the last example in Normal distn notation?
Standard Normal Distribution • The standard Normal distribution has mean 0 and standard deviation 1. • A standard Normal distribution is the set of all z-scores.
Analyze It!!! • Suppose SAT scores among college students are normally distributed with a mean of 500 and a standard deviation of 100. If a student scores a 700, what would be her z-score?
Analyze It!!! • A set of math test scores has a mean of 70 and a standard deviation of 8. • A set of English test scores has a mean of 74 and a standard deviation of 16. • For which test would a score of 78 have a higher standing?
Analyze It!!! • What will be the miles per gallon for a Toyota Camry when the average mpg is 23, it has a z value of 1.5 and a standard deviation of 5?
Area Under the Curve: Z-Score • Finding proportions of observation is from the standard Normal distribution given a z-score.
Finding Area Given Z-score • Find the area under the curve that lies to the left of z=1.46.
Finding Area Given Z-score • Find the area under the curve that lies to the left of z=1.46.
Finding Area Given Z-score • Find the area under the curve that lies to the right of z=1.46.
Find the P-values… • Find the p-value for the area that lies to the left of z=-0.58. • Find the p-value for the area that lies between z=-1.16 and z=2.71.
More P-values • Find the z-score given the p-value of 0.905. • Find the z-score given the p-value of 0.0735.