Download
1 / 35
350 likes | 504 Views
Remote Sensing and Image Processing: 3. Dr. Mathias (Mat) Disney UCL Geography Office: 301, 3rd Floor, Chandler House Tel: 7670 4290 Email: mdisney@geog.ucl.ac.uk www.geog.ucl.ac.uk/~mdisney. Back to the process. What sort of parameters are of interest?

E N D
Remote Sensing and Image Processing: 3 Dr. Mathias (Mat) Disney UCL Geography Office: 301, 3rd Floor, Chandler House Tel: 7670 4290 Email: mdisney@geog.ucl.ac.uk www.geog.ucl.ac.uk/~mdisney
Back to the process.... • What sort of parameters are of interest? • Variables describing Earth system....
External forcing Hydrosphere Cryosphere Atmosphere Geosphere Biosphere EO and the Earth “System” From Ruddiman, W. F., 2001. Earth's Climate: past and future.
Example biophysical variables After Jensen, p. 9
Example biophysical variables Good discussion of spectral information extraction: http://dynamo.ecn.purdue.edu/~landgreb/Principles.pdf After Jensen, p. 9
Analogue image processing Image interpretation Presentation of information • Tone, colour, stereo parallax • Size, shape, texture, pattern, fractal dimension • Height/shadow • Site, association Primary elements Spatial arrangements Secondary elements Context • Multi: • spectral, spatial, temporal, angular, scale, disciplinary • Statistical/rule-based patterns • Hyperspectral • Modelling and simulation • Multi: • spectral, spatial, temporal, angular, scale, disciplinary • Visualisation • Ancillary info.: field and lab measurements, literature etc. Information extraction process After Jensen, p. 22
Example: Vegetation canopy modelling • Develop detailed 3D models • Simulate canopy scattering behaviour • Compare with observations
Electromagnetic (EM) Spectrum • Core principles of electromagnetic radiation (EMR) • solar radiation • blackbody concept and radiation laws • EMR and remote sensing • wave and particle models of radiation • regions of EM spectrum • interaction with atmosphere • interaction with surface • Measurement of radiation
EM spectrum: so what? • This is what we measure in remote sensing • Terms, units, definitions • Provide basis for understanding type of information that can be retrieved • Why we choose given regions of the EM spectrum in which to make measurements
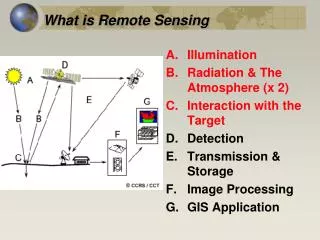
Remote sensing process: recap • Note various paths • Source to sensor direct? • Source to surface to sensor • Sensor can also be source • RADAR, LiDAR, SONAR • i.e. “active” remote sensing • Reflected and emitted components • What do these mean? • Several components of final signal captured at sensor
Energy transport • Conduction • transfer of molecular kinetic (motion) energy due to contact • heat energy moves from T1 to T2 where T1 > T2 • Convection • movement of hot material from one place to another • e.g. Hot air rises • Radiation • results whenever an electrical charge is accelerated • propagates via EM waves, through vacuum & over long distances hence of interest for remote sensing
EM Spectrum • EM Spectrum • Continuous range of EM radiation • From very short wavelengths (<300x10-9m) • high energy • To very long wavelengths (cm, m, km) • low energy • Energy is related to wavelength (and hence frequency)
Energy radiated from sun (or active sensor) • Energy 1/wavelength (1/) • shorter (higher f) == higher energy • longer (lower f) == lower energy from http://rst.gsfc.nasa.gov/Intro/Part2_4.html
Units • EM wavelength is m, but various prefixes • cm (10-2m) • mm (10-3m) • micron or micrometer, m (10-6m) • Angstrom, Å (10-8m, used by astronomers mainly) • nanometer, nm (10-9) • f is waves/second or Hertz (Hz) • NB can also use wavenumber, k = 1/ i.e. m-1
EM Spectrum • We will see how energy is related to frequency, f (and hence inversely proportional to wavelength, ) • When radiation passes from one medium to another, speed of light (c) and change, hence f stays the same
Electromagnetic spectrum: visible • Visible part - very small part • from visible blue (shorter ) • to visible red (longer ) • ~0.4 to ~0.7m Violet: 0.4 - 0.446 m Blue: 0.446 - 0.500 m Green: 0.500 - 0.578 m Yellow: 0.578 - 0.592 m Orange: 0.592 - 0.620 m Red: 0.620 - 0.7 m
Electromagnetic spectrum: IR • Longer wavelengths (sub-mm) • Lower energy than visible • Arbitrary cutoff • IR regions covers • reflective (shortwave IR, SWIR) • and emissive (longwave or thermal IR, TIR) • region just longer than visible known as near-IR, NIR.
Electromagnetic spectrum: microwave • Longer wavelength again • RADAR • mm to cm • various bands used by RADAR instruments • long so low energy, hence need to use own energy source (active wave)
Electromagnetic spectrum • Interaction with the atmosphere • transmission NOT even across the spectrum • need to choose bands carefully to coincide with regions where transmission high (atmospheric windows – see later)
“Blackbody” concept • All objects above absolute zero (0 K or -273° C) radiate EM energy (due to vibration of atoms) • We can use concept of a perfect blackbody • Absorbs and re-radiates all radiation incident upon it at maximum possible rate per unit area (Wm-2), at each wavelength, , for a given temperature T (in K) • No real object is blackbody but it is v. useful assumption • Energy from a blackbody?
Stefan-Boltzmann Law • Total emitted radiation from a blackbody, M, in Wm-2, described by Stefan-Boltzmann Law • Where T is temperature of the object in K; and = is Stefan-Boltzmann constant = 5.6697x10⁻⁸ Wm-2K-4 • So energy T4 and as T so does M • Tsun 6000K M,sun 73.5 MWm-2 • TEarth 300K M , Earth 460 Wm-2
Stefan-Boltzmann Law • Note that peak of sun’s energy around 0.5 m • negligible after 4-6m • Peak of Earth’s radiant energy around 10 m • negligible before ~ 4m • Total energy in each case is area under curve
Peak of emitted radiation: Wien’s Law • Wien deduced from thermodynamic principles that energy per unit wavelength E() is function of T and • At what mis maximum radiant energy emitted? • Comparing blackbodies at different T, note mT is constant, k = 2897mK i.e. m = k/T • m, sun = 0.48m • m, Earth = 9.66m
Increasing Wien’s Law • AKA Wien’s Displacement Law • Increase (displacement) in mas T reduces • Straight line in log-log space
Planck’s Law of blackbody radiation • Planck was able to explain energy spectrum of blackbody • Based on quantum theory rather than classical mechanics • dE()/d gives constant of Wien’s Law • E() over all results in Stefan-Boltzmann relation • Blackbody energy function of , and T http://www.tmeg.com/esp/e_orbit/orbit.htm
Planck’s Law • Explains/predicts shape of blackbody curve • Use to predict how much energy lies between given • Crucial for remote sensing http://hyperphysics.phy-astr.gsu.edu/hbase/bbrc.html#c1
Consequences of Planck’s Law • Allows us to explain radiant energy distribution of any object (e.g. sun) • Predict at what peak energy is emitted and so choose our spectral bands accordingly • Chlorophyll a,b absorption spectra • Photosynthetic pigments • Driver of (nearly) all life on Earth! • Source of all fossil fuel
Recap • Physical properties we might measure • E.g. reflectance, temperature, height etc. • EM radiation is what we measure in RS • Blackbody concept used to explain energy distribution of sun / Earth • Stefan-Boltzmann law explains total energy • Wien’s law explains shift of max with decreasing T • Planck’s Law explains shape of BB energy distribution • BUT remember, no object is really a blackbody – only an approximation
MODIS: building global picture From http://visibleearth.nasa.gov/Sensors/Terra/
QuickBird: 16.5km swath at nadir, 61cm! panchromatic, 2.44m multispectral • http://www.digitalglobe.com • IKONOS: 11km swath at nadir, 1m panchromatic, 4m multispectral • http://www.spaceimaging.com/ IKONOS & QuickBird: very local view!
Ikonos: high res. commercial http://www.spaceimaging.com/gallery/spacepics/khaolak_side_by_side.jpg
Ikonos: high res. commercial http://www.euspaceimaging.com/sime.asp?page=Gallery