Download
1 / 44
460 likes | 697 Views
Cardiovascular System ANALYSIS Dr.Mohammed Sharique Ahmed Quadri Asst. P rofessor P hysiology Almaarefa College. ELECTROCARDIOGRAM (ECG). بسم الله الرحمن الرحيم. The simple steps to analyze the ECG How to calculate the heart rate. How to analyze the rhythm.

E N D
Cardiovascular System ANALYSIS Dr.Mohammed Sharique Ahmed Quadri Asst. Professor Physiology Almaarefa College ELECTROCARDIOGRAM (ECG) بسم الله الرحمن الرحيم
The simple steps to analyze the ECG How to calculate the heart rate. How to analyze the rhythm. To calculate the QRS axis At the end of this lecture we will learn
The 12-Leads The 12-leads include: • 3 Limb leads (I, II, III) • 3 Augmented leads (aVR, aVL, aVF) • 6 Precordial leads (V1- V6)
Views of the Heart Left Lateral portion of the heart( I , Avl, v5,v6) Some leads get a good view of the: Anterior portion of the heart (V1,V2,- setum V3,V4-)- anterior Inferior portion of the heart II, III, aVF
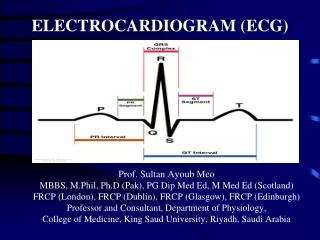
The “PQRST” • P wave - Atrial depolarization • QRS - Ventricular depolarization • T wave - Ventricular repolarization
The PR Interval Atrial depolarization + delay in AV junction (AV node/Bundle of His) (delay allows time for the atria to contract before the ventricles contract)
PR interval: 0.12 – 0.20 sec QRS interval : 0.08 – 0.10sec QT interval : 0.40-0.43sec ST interval :0.32 - sec Segments & intervals
Rhythm analysis • Analyzing individual wave & segments • Determine the mean electrical axis How to read the ecg
Rhythm Analysis • Step 1: Determine regularity. • Step 2: Calculate rate. • Step 3: Assess the P waves. • Step 4: Determine PR interval. • Step 5: Determine QRS duration.
1-Determine regularity R R • Look at the R-R distances (using a caliper or markings with a pen on paper). • Regular (are they equidistant apart)? Occasionally irregular? Regularly irregular? Irregularly irregular? Interpretation? Regular
2-Calculating heart rate • Find the R wave that falls on, or nearly on, one of the heavy lines. • Count the number of large square or small square until the next R wave • Deter mine the heart rate by applying following formula
H.R = 1500 NO OF SMALL SQURES BETWEEN R-R WAVES OR H.R = 300 NO OF BIG SQURES BETWEEN R-R WAVES 2-Calculating heart rate
Calculate Rate • Option 2 • Find a R wave that lands on a bold line. • Count the # of large boxes to the next R wave. If the second R wave is 1 large box away the rate is 300, 2 boxes - 150, 3 boxes - 100, 4 boxes - 75, etc. (cont) R wave
3-Assess the P waves • Are there P waves? • Do the P waves all look alike? • Do the P waves occur at a regular rate? • Is there one P wave before each QRS? Interpretation? Normal P waves with 1 P wave for every QRS
4-Determine PR interval • Normal: 0.12 - 0.20 seconds. (3 - 5 boxes) Interpretation? 0.12 seconds
5-QRS duration • Normal: 0.04 - 0.12 seconds. (1 - 3 boxes) Interpretation? 0.08 seconds
Rhythm Summary • Regularity regular • Rate 90-95 bpm • P waves normal • PR interval 0.12 s • QRS duration 0.08 s Interpretation? Normal Sinus Rhythm
Calculate Heart Rate. Normal ECG
Variations in Sinus Rhythm • Rate? 35 bpm • Regularity? regular • P waves? normal • PR interval? 0.12 s • QRS duration? 0.10 s Interpretation? Sinus Bradycardia
Variations in Sinus Rhythm • Rate? 130 bpm • Regularity? regular • P waves? normal • PR interval? 0.16 s • QRS duration? 0.08 s Interpretation? Sinus Tachycardia
INTERPRETE THE ECG ? SINUS ARHYTHMIA Observe Variation in Heart Rate during Inspiration and Expiration. [Increased Heart Rate during Inspiration]
Atrial Fibrillation • Deviation from NSR • No organized atrial depolarization, so no normal P waves (impulses are not originating from the sinus node). • The atrial rate is usually above 350 beats per minute • Atrial activity is chaotic (resulting in an irregularly irregular rate). • Common, affects 2-4%, up to 5-10% if > 80 years old
Atrial Flutter • Rate? 70 bpm • Regularity? regular • P waves? flutter waves • PR interval? none • QRS duration? 0.06 s Interpretation? Atrial Flutter
AV Nodal Blocks • 1st Degree AV Block • 2nd Degree AV Block, MobitzType I • 2nd Degree AV Block,MobitzType II • 3rd Degree AV Block
Take a look at this ECG. What do you notice • Rate? 60 bpm • Regularity? regular • P waves? normal • PR interval? 0.36 s • QRS duration? 0.08 s Interpretation? 1st Degree AV Block PR Interval > 0.20 s Etiology:Prolonged conduction delay in the AV node or Bundle of His.
Take a look at this ECG. What do you notice • Rate? 50 bpm • Regularity? regularly irregular • P waves? normal, but 4th no QRS • PR interval? lengthens • QRS duration? 0.08 s Interpretation? 2nd Degree AV Block, Type I • PR interval progressively lengthens, then the impulse is completely blocked (P wave not followed by QRS). • Etiology: Each successive atrial impulse encounters a longer and longer delay in the AV node until one impulse (usually the 3rd or 4th) fails to make it through the AV node.
Take a look at this ECG. What do you notice • Rate? 40 bpm • Regularity? regular • P waves? normal, 2 & 3 no QRS • PR interval? 0.14 s • QRS duration? 0.08 s Interpretation? 2nd Degree AV Block, Type II Occasional P waves are completely blocked (P wave not followed by QRS). Etiology:Conduction is all or nothing (no prolongation of PR interval); typically block occurs in the Bundle of His.
Take a look at this ECG. What do you notice • Rate? 40 bpm • Regularity? regular • P waves? no relation to QRS • PR interval? none • QRS duration? wide (> 0.12 s) Interpretation? 3rd Degree AV Block Etiology: There is complete block of conduction in the AV junction, so the atria and ventricles form impulses independently of each other. Without impulses from the atria, the ventricles own intrinsic pacemaker kicks in at around 30 - 45 beats/minute.
Remember • When an impulse originates in a ventricle, conduction through the ventricles will be inefficient and the QRS will be wide and bizarre.
Determination of Mean Electrical Axis Axis refers to the mean QRS axis (or vector) during ventricular depolarization. As you recall when the ventricles depolarize (in a normal heart) the direction of current flows leftward and downward because most of the ventricular mass is in the left ventricle. We like to know the QRS axis because an abnormal axis can suggest disease such as pulmonary hypertension from a pulmonary embolism.
When a vector is exactly horizontal and directed toward the person’s left side,the vector is said to extend in the direction of 0 degrees • From this zero reference point, the scale of vectors rotates clockwise:
I IIIII FORMATION OF HEXA-AXIAL SYSTEM I II III
aVR aVL aVF FORMATION OF HEXAAXIAL SYSTEM
-90 -120 -60 aVR aVL -150 -30 180 0 I +150 +30 III+120 +60 II +90 aVF FORMATION OF HEXAAXIAL SYSTEM
-90o -60o -120o -150o -30o 180o 0o 30o 150o 60o 120o 90o Determination of Mean Electrical Axis The QRS axis is determined by overlying a circle, in the frontal plane. By convention, the degrees of the circle are as shown. The normal QRS axis lies between -30oand +110o. A QRS axis that fallsbetween -30oand-90o is abnormal and called left axis deviation. A QRS axis that falls between+110oand+180o is abnormal and called right axis deviation. A QRS axis that falls between+180oand-90ois abnormal and called Indeterminant (extende rt axis ) .
How to calculate the qrs axis • Leads & there isoelectric partners
Determining QRS axis Indeterminant /extended RAD LAD RAD NORMAL AXIS
How to calculate the QRS axis … if the QRS is negative in lead I and negative in lead II what is the QRS axis? (normal, left, right or right superior axis deviation) QRS Complexes I aVF Axis + + normal + - left axis deviation right axis deviation - + - - right superior axis deviation/ indeterminant
What is Axis ? Normal ECG
References • The ECG made Easy by John R.Hampton 7th edition • The only EKG book you will ever need,Malcolm.S.Thaler, seventh edition • Introduction to ECG interpretation BY Frank G. Yanowitz