Download
1 / 35
350 likes | 444 Views
Indonesia Australia South East Queensland. SEQ. Step 1: run CCAM at 200 km resolution globally using SST (bias correction) only from AR4 GCM: GFDL2.0, GFDL2.1, ECHAM5, MIROC-medres, UKMO-hadcm3 and CSIRO Mark3.5. (1971-2000, 2041-2060, 2081-2100)

E N D
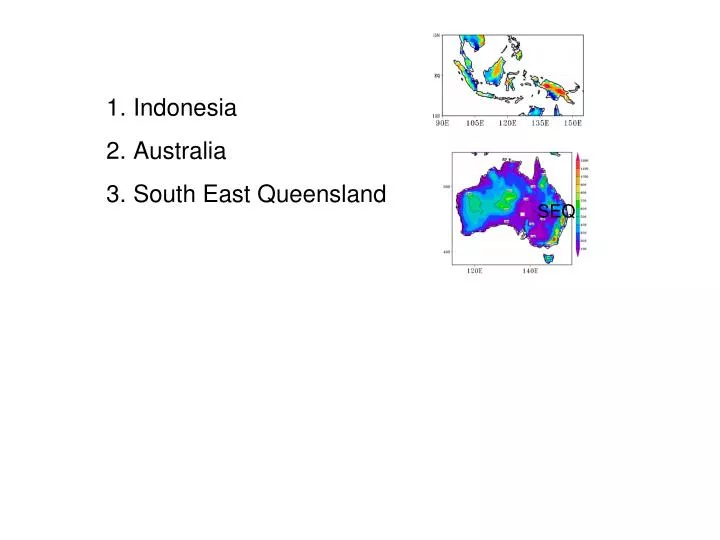
Indonesia • Australia • South East Queensland SEQ
Step 1: run CCAM at 200 km resolution globally using SST (bias correction) only from AR4 GCM: GFDL2.0, GFDL2.1, ECHAM5, MIROC-medres, UKMO-hadcm3 and CSIRO Mark3.5. (1971-2000, 2041-2060, 2081-2100) Step 2: nested CCAM at 20 km resolution over the Indonesia in the CCAM 200 km in Step 1 (1971-2000, 2041-2060, 2081-2100) .
January and July SST Bias in Mk3.5
GFDLCM2.1 : 1971-2000 rainfall (mm/day) DJF MAM JJA SON OBS CCAM GCM
ECHAM5 : 1971-2000 rainfall (mm/day) Surface height DJF MAM JJA SON OBS CCAM GCM
Maximum temperature (C) (1971-2000) Surface height DJF MAM JJA SON OBS CCAM MIROC-Med
Minimum temperature (C) (1971-2000) Surface height DJF MAM JJA SON OBS CCAM MIROC-Med
850 hPa wind 1971-2000 NCEP CCAM GFDL2.1 ECHAM5
200 hPa wind 1971-2000 NCEP CCAM GFDL2.1 ECHAM5
GFDLCM2.1: Rainfall change 2050 CCAM GCM 2090 CCAM GCM
2050 ECHAM5: Rainfall change CCAM GCM 2090 CCAM GCM
CCAM results: Maximum temperature change center 2050 DJF MAM JJA SON ANN GFDL2.1 EACHAM5 UKMO_Hadcm3
CCAM results: Maximum temperature change center 2070 DJF MAM JJA SON ANN GFDL2.1 EACHAM5 UKMO_Hadcm3
CCAM results Minimum temperature change centred 2050 DJF MAM JJA SON ANN GFDL2.1 EACHAM5 UKMO_Hadcm3
CCAM results Minimum temperature change centred 2070 DJF MAM JJA SON ANN GFDL2.1 EACHAM5 UKMO_Hadcm3
CCAM simulation nested in NCEP reanalysis one validation for Australian region
Pattern Corr 0.85 Pattern Corr 0.70
Pattern Corr 0.76 Pattern Corr 0.66
Rainfall extreme (mm/day) Obs CCAM
All-Australia 1982-83 1997-98 1998-99 2000-01
Trend Significant Obs Obs CCAM CCAM
Trend Obs CCAM
Correlation rainfall and UIND (25-30S,160-180E) OBS CCAM
SEQ rain UIND
Rainfall and 850-wind anomaly Strong-UIND Weak- UIND OBS CCAM
850-mean wind and rain ENSO pattern of 850 hPa wind
Conclusions: SEQ rainfall declined probably is consequence of climate shift around mid-1970s toward El Nino like condition which weakens easterly trades, therefore reduces SEQ rainfall.