Download
1 / 1
10 likes | 99 Views
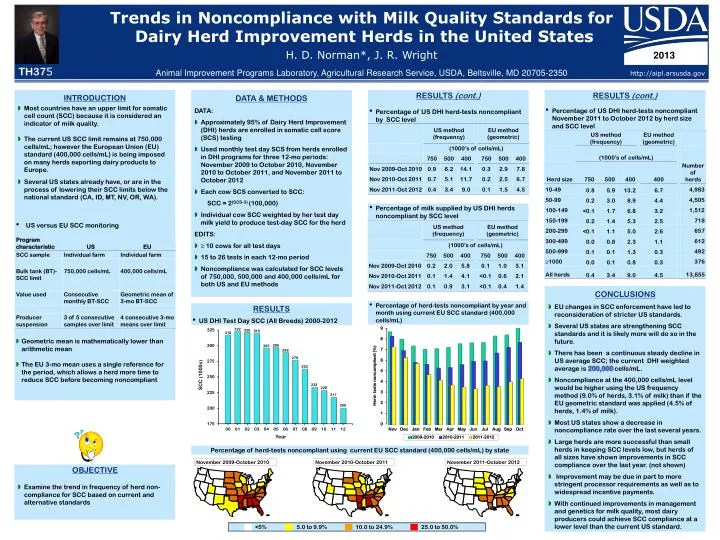
Trends in Noncompliance with Milk Quality Standards for Dairy Herd Improvement Herds in the United States H. D. Norman*, J. R. Wright Animal Improvement Programs Laboratory, Agricultural Research Service, USDA, Beltsville, MD 20705-2350. 2013. TH37 5. http://aipl.arsusda.gov.

E N D
Trends in Noncompliance with Milk Quality Standards for Dairy Herd Improvement Herds in the United States H. D. Norman*, J. R. Wright Animal Improvement Programs Laboratory, Agricultural Research Service, USDA, Beltsville, MD 20705-2350 2013 TH375 http://aipl.arsusda.gov INTRODUCTION • Most countries have an upper limit for somatic cell count (SCC) because it is considered an indicator of milk quality. • The current US SCC limit remains at 750,000 cells/mL; however the European Union (EU) standard (400,000 cells/mL) is being imposed on many herds exporting dairy products to Europe. • Several US states already have, or are in the process of lowering their SCC limits below the national standard (CA, ID, MT, NV, OR, WA). • DATA & METHODS • DATA: • Approximately 95% of Dairy Herd Improvement (DHI) herds are enrolled in somatic cell score (SCS) testing • Used monthly test day SCS from herds enrolled in DHI programs for three 12-mo periods: November 2009 to October 2010, November 2010 to October 2011, and November 2011 to October 2012 • Each cow SCS converted to SCC: • SCC = 2(SCS-3) (100,000) • Individual cow SCC weighted by her test day milk yield to produce test-day SCC for the herd • EDITS: • ≥ 10 cows for all test days • 15 to 26 tests in each 12-mo period • Noncompliance was calculated for SCC levels of 750,000, 500,000 and 400,000 cells/mL for both US and EU methods RESULTS (cont.) RESULTS (cont.) • Percentage of US DHI herd-tests noncompliant November 2011 to October 2012 by herd size and SCC level • Percentage of US DHI herd-tests noncompliant by SCC level • Percentage of milk supplied by US DHI herds noncompliant by SCC level • US versus EU SCC monitoring CONCLUSIONS • EU changes in SCC enforcement have led to reconsideration of stricter US standards. • Several US states are strengthening SCC standards and it is likely more will do so in the future. • There has been a continuous steady decline in US average SCC; the current DHI weighted average is 200,000cells/mL. • Noncompliance at the 400,000 cells/mL level would be higher using the US frequency method (9.0% of herds, 3.1% of milk) than if the EU geometric standard was applied (4.5% of herds, 1.4% of milk). • Most US states show a decrease in noncompliance rate over the last several years. • Large herds are more successful than small herds in keeping SCC levels low, but herds of all sizes have shown improvements in SCC compliance over the last year. (not shown) • Improvement may be due in part to more stringent processor requirements as well as to widespread incentive payments. • With continued improvements in management and genetics for milk quality, most dairy producers could achieve SCC compliance at a lower level than the current US standard. • Percentage of herd-tests noncompliant by year and month using current EU SCC standard (400,000 cells/mL) RESULTS • US DHI Test Day SCC (All Breeds) 2000-2012 • Geometric mean is mathematically lower than arithmetic mean • The EU 3-mo mean uses a single reference for the period, which allows a herd more time to reduce SCC before becoming noncompliant SCC (1000s) Year Percentage of herd-tests noncompliant using current EU SCC standard (400,000 cells/mL) by state November 2009-October 2010 November 2010-October 2011 November 2011-October 2012 OBJECTIVE • Examine the trend in frequency of herd non-compliance for SCC based on current and alternative standards <5% 5.0 to 9.9% 10.0 to 24.9% 25.0 to 50.0%