Download
1 / 33
330 likes | 399 Views
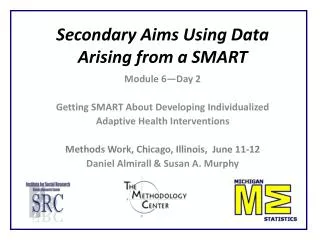
Primary Aims Using Data Arising from a SMART (Part II). Module 5—Day 2 Getting SMART About Developing Individualized Sequences of Adaptive Health Interventions Methods Work, Chicago, Illinois, June 11-12 Daniel Almirall & Susan A. Murphy. Primary Aims Part II, Outline.

E N D
Primary Aims Using Data Arising from a SMART (Part II) Module 5—Day 2 Getting SMART About Developing Individualized Sequences of Adaptive Health Interventions Methods Work, Chicago, Illinois, June 11-12 Daniel Almirall & Susan A. Murphy
Primary Aims Part II, Outline • Review the weighted regression approach for estimating the mean outcome had the entire population followed 1 of the embedded ATSs • PII(a): Learn how to compare the mean outcome for two embedded ATSs that begin with different treatments using a weighting approach. (How to do this in one regression?) • PII(b): Learn how to compare all of the SMART- embedded ATSs (simultaneously) using a weighting-and-replication approach
Recall the Prototypical SMART Design: ADHD SMART Example Continue Medication Responders Medication Increase Medication Dose R Non-Responders Add Behavioral Intervention R Continue Behavioral Intervention Responders Behavioral Intervention Increase Behavioral Intervention R Non-Responders Add Medication O1 A1 O2 / R Status A2 Y
Recall Typical Primary Aim 3: Best of two adaptive interventions? • We seek to learn how to answer the question of which is the best of the following two “design-embedded” ATSs? First treat with medication, then • If respond, then continue treating with medication • If non-response, then add behavioral intervention versus First treat with behavioral intervention, then • If response, then continue behavioral intervention • If non-response, then add medication
Already learned how to estimate the mean under red (MED,BMOD) ATS via weighting Cont. MED 2*N/2 Responders • Assign W = weight = 2 to responders to MED • Assign W = weight = 4 to non-responders to MED • This “balances out” the responders and non-responders. Then we take W-weighted mean of sample who ended up in the 2 boxes. 1.00 Medication Increase Medication Dose 0.5 R Non-Responders Add BMOD 4*N/4 0.5 R(N)
Similar code can be used to estimate mean outcome under blue (BMOD,MED) ATS Continue Medication Responders Medication Increase Medication Dose R Non-Responders Add Behavioral Intervention R Continue Behavioral Intervention Responders Behavioral Intervention Increase Behavioral Intervention R Non-Responders Add Medication O1 A1 O2 / R Status A2 Y
Results: Estimate of mean outcome had population followed (BMOD, MED) ATS Analysis Of GEE Parameter Estimates Parameter Estimate SError P-value Intercept 3.0982 0.1070 <.0001 Z1 0.4085 0.1070 0.0001 Contrast Estimate Results 95% Conf Limits Estimate Lower Upper SError Mean Y under 3.5067 3.1643 3.8490 0.1747 the blue ATS This analysis is with simulated data.
Try it yourself in SAS • Go to the file: “sas_code_modules_4_5_and_6_ADHD.doc” • Copy the SAS code from Page 1 through Page 6 • Paste into SAS Enhanced Editor window • Press F8 or click the Submit button (the little running man)
Results: Estimate of mean outcome had population followed (BMOD, MED) ATS Analysis Of GEE Parameter Estimates Parameter Estimate SError P-value Intercept 3.0982 0.1070 <.0001 Z1 0.4085 0.1070 0.0001 Contrast Estimate Results 95% Conf Limits Estimate Lower Upper SError Mean Y under 3.5067 3.1643 3.8490 0.1747 the blue ATS This analysis is with simulated data.
Primary Aims Part II, Outline • Review the weighted regression approach for estimating the mean outcome had the entire population followed 1 of the embedded ATSs • PII(a): Learn how to compare the mean outcome for two embedded ATSs that begin with different treatments using a weighting approach. (How to do this in one regression?) • PII(b): Learn how to compare all of the SMART- embedded ATSs (simultaneously) using a weighting-and-replication approach
How do we compare mean outcomes for participants in red versus those in blue? Continue Medication Responders Medication Increase Medication Dose R Non-Responders Add Behavioral Intervention R Continue Behavioral Intervention Responders Behavioral Intervention Increase Behavioral Intervention R Non-Responders Add Medication O1 A1 O2 / R Status A2 Y
SAS code for a weighted regression to analyze Typical Primary Aim 3 data dat7; set dat2; Z1=-1; Z2=-1; W=4*R + 2*(1-R); if A1*R=-1 then Z1=1; if (1-A1)*(1-R)*A2=-2 then Z1=1; if A1*R= 1 then Z2=1; if (1+A1)*(1-R)*A2=-2 then Z2=1; run; data dat8; set dat7; if Z1=1 orZ2=1 run; procgenmoddata = dat8; class id; model y = z1; scwgt w; repeated subject = id / type = ind; estimate'Mean Y under red ATS' intercept 1 z1 1; estimate'Mean Y under blue ATS' intercept 1 z1 -1; estimate' Diff: red - blue' z1 2; run; A key step: This regression should be done only with the participants following the red or the blue ATSs. Leave out others! This analysis is with simulated data.
Primary Aim 3 Results Analysis Of GEE Parameter Estimates Parameter Estimate SError P-value Intercept 3.1858 0.1221 <.0001 Z1 -0.3209 0.1221 0.0086 Contrast Estimate Results 95% ConfLimits Estimate Lower Upper SError Mean Y under red ATS 2.8649 2.5305 3.1992 0.1706 Mean Y under blue ATS 3.5067 3.1643 3.8490 0.1747 Diff: red - blue -0.6418 -1.1203 -0.1633 0.2442 This analysis is with simulated data.
Try it yourself in SAS • Go to the file: “sas_code_modules_4_5_and_6_ADHD.doc” • Copy the SAS code on Page 7 • Paste into SAS Enhanced Editor window • Press F8 or click the Submit button (the little running man)
Primary Aim 3 Results Analysis Of GEE Parameter Estimates Parameter Estimate SError P-value Intercept 3.1858 0.1221 <.0001 Z1 -0.3209 0.1221 0.0086 Contrast Estimate Results 95% ConfLimits Estimate Lower Upper SError Mean Y under red ATS 2.8649 2.5305 3.1992 0.1706 Mean Y under blue ATS 3.5067 3.1643 3.8490 0.1747 Diff: red - blue -0.6418 -1.1203 -0.1633 0.2442 This analysis is with simulated data.
Primary Aims Part II, Outline • Review the weighted regression approach for estimating the mean outcome had the entire population followed 1 of the embedded ATSs • PII(a): Learn how to compare the mean outcome for two embedded ATSs that begin with different treatments using a weighting approach. (How to do this in one regression?) • PII(b): Learn how to compare all of the SMART- embedded ATSs (simultaneously) using a weighting-and-replication approach
What about a regression that allows comparison of mean under all four ATSs? Continue Medication Responders Medication Increase Medication Dose R Non-Responders Add Behavioral Intervention R Continue Behavioral Intervention Responders Behavioral Intervention Increase Behavioral Intervention R Non-Responders Add Medication O1 A1 O2 / R Status A2 Y
What about a regression that allows comparison of mean under all four ATSs? Continue Medication Responders Medication Increase Medication Dose R Non-Responders Add Behavioral Intervention R Continue Behavioral Intervention Responders Behavioral Intervention Increase Behavioral Intervention R Non-Responders Add Medication O1 A1 O2 / R Status A2 Y
Note that all responders are consistent with 2 of the embedded ATS. For example, … Continue Medication Responders Medication Increase Medication Dose R Non-Responders Add Behavioral Intervention Continue Medication Responders Medication Increase Medication Dose R Non-Responders Add Behavioral Intervention
So, since all responders are consistent with 2 of the embedded ATSs, we… • We just need to “trick” or “explain” this to SAS • Do this by replicating responders: • Create 2 observations for each responder • We assign ½ of them A2=1, the other ½ A2=-1 • As before, assign W=2 to responders and W=4 to non-responders • Robust standard errors take care of the fact that we are “re-using” the responders. No cheating here!
Pictorially, what does the replication do? Continue MED Responders Medication Increase MED R Non-Responders Add BMOD Continue MED R Responders Continue MED Medication Increase MED R Non-Responders Add BMOD
SAS code for replication-and-weighting to compare means under all four ATSs data dat9; set dat2; * define weights and create responders replicates * (with equal "probability of getting A2"); if R=1 then do; ob = 1; A2 =-1; weight = 2; output; ob = 2; A2 = 1; weight = 2; output; end; else if R=0 then do; ob = 1; weight = 4; output; end; run; This analysis is with simulated data.
Try it yourself in SAS • Go to the file: “sas_code_modules_4_5_and_6_ADHD.doc” • Copy the SAS code on Page 8 • Paste into SAS Enhanced Editor window • Press F8 or click the Submit button (the little running man)
After replication-and-weighting, the SAS code for the weighted regression to estimate mean under all four ATSs is easy! procgenmod data = dat9; class id; model y = a1 a2 a1*a2; scwgt weight; repeated subject = id / type = ind; estimate 'Mean Y under red ATS' int 1 a1 -1 a2 -1 a1*a2 1; estimate 'Mean Y under blue ATS' int 1 a1 1 a2 -1 a1*a2 -1; estimate 'Mean Y under green ATS' int 1 a1 -1 a2 1 a1*a2 -1; estimate 'Mean Y under orange ATS' int 1 a1 1 a2 1 a1*a2 1; estimate ' Diff: red - blue' int 0 a1 -2 a2 0 a1*a2 0; estimate ' Diff: orange - blue' int 0 a1 0 a2 2 a1*a2 2; estimate ' Diff: green - blue' int 0 a1 -2 a2 2 a1*a2 0; * etc...; run; Why only four parameters? Because there are only 4 means in total that we wish to estimate. This analysis is with simulated data.
Results: replication-and-weighting to estimate mean outcome under all 4 ATSs Contrast Estimate Results 95% Conf Limits Estimate Lower Upper P-value Mean Y under red ATS 2.8649 2.5305 3.1992 <0.0001 Mean Y under blue ATS 3.5067 3.1643 3.8490 <0.0001 Mean Y under green ATS 2.7895 2.4644 3.1145 <0.0001 Mean Y under orange ATS 2.6533 2.2515 3.0552 <0.0001 Diff: red - blue -0.6418 -1.1203 -0.1633 0.0086 etc... etc... NOTE: We get the exact same results as before when we compared red vs blue, but now we can simultaneously make inference for all the comparisons. This analysis is with simulated data.
Try it yourself in SAS • Go to the file: “sas_code_modules_4_5_and_6_ADHD.doc” • Copy the SAS code on Page 9 • Paste into SAS Enhanced Editor window • Press F8 or click the Submit button (the little running man)
Results: replication-and-weighting to estimate mean outcome under all 4 ATSs Contrast Estimate Results 95% Conf Limits Estimate Lower Upper P-value Mean Y under red ATS 2.8649 2.5305 3.1992 <0.0001 Mean Y under blue ATS 3.5067 3.1643 3.8490 <0.0001 Mean Y under green ATS 2.7895 2.4644 3.1145 <0.0001 Mean Y under orange ATS 2.6533 2.2515 3.0552 <0.0001 Diff: red - blue -0.6418 -1.1203 -0.1633 0.0086 etc... etc... NOTE: We get the exact same results as before when we compared red vs blue, but now we can simultaneously make inference for all the comparisons. This analysis is with simulated data.
Replication-and-weighting to estimate outcome under all 4 ATSs with more power Improve efficiency: Adjusting for baseline covariates that are associated with outcome leads to more efficient estimates (lower standard error = more power = smaller p-value). procgenmod data = dat7; class id; model y = a1 a2 a1*a2 o12c o14c; scwgt weight; repeated subject = id / type = ind; estimate 'Mean Y under red ATS' int 1 a1 -1 a2 -1 a1*a2 1; estimate 'Mean Y under blue ATS' int 1 a1 1 a2 -1 a1*a2 -1; estimate 'Mean Y under green ATS' int 1 a1 -1 a2 1 a1*a2 -1; estimate 'Mean Y under orange ATS' int 1 a1 1 a2 1 a1*a2 1; estimate ' Diff: red - blue' a1 -2 a2 0 a1*a2 2; estimate ' Diff: orange - blue' int 0 a1 0 a2 2 a1*a2 2; estimate ' Diff: green - blue' int 0 a1 -2 a2 2 a1*a2 0; * etc...; run; This analysis is with simulated data.
Results: more powerfulwtd. Regression to estimate mean outcome under all 4 ATSs Improved efficiency: Adjusting for baseline covariates resulted in tighter confidence intervals. Point estimates remained about the same, as expected. Contrast Estimate Results 95% Conf Limits Estimate Lower Upper P-value Mean Y under red ATS 2.8801 2.5869 3.1733 <0.0001 Mean Y under blue ATS 3.3854 3.0689 3.7018 <0.0001 Mean Y under green ATS 2.8149 2.5163 3.1135 <0.0001 Mean Y under orange ATS 2.7338 2.3596 3.1081 <0.0001 Diff: red - blue -0.5053 -0.9401 -0.0704 0.0228 etc... etc... This analysis is with simulated data.
Try it yourself in SAS • Go to the file: sas_code_modules_4_5_and_6_ADHD.doc • Copy the SAS code on Page 10 • Paste into SAS Enhanced Editor window • Press F8 or click the Submit button (the little running guy)
Results: more powerfulwtd. Regression to estimate mean outcome under all 4 ATSs Improved efficiency: Adjusting for baseline covariates resulted in tighter confidence intervals. Point estimates remained about the same, as expected. Contrast Estimate Results 95% Conf Limits Estimate Lower Upper P-value Mean Y under red ATS 2.8801 2.5869 3.1733 <0.0001 Mean Y under blue ATS 3.3854 3.0689 3.7018 <0.0001 Mean Y under green ATS 2.8149 2.5163 3.1135 <0.0001 Mean Y under orange ATS 2.7338 2.3596 3.1081 <0.0001 Diff: red - blue -0.5053 -0.9401 -0.0704 0.0228 etc... etc... This analysis is with simulated data.
Citations • Murphy, S. A. (2005). An experimental design for the development of adaptive treatment strategies. Statistics in Medicine, 24, 455-1481. • Nahum-Shani, I., Qian, M., Almirall, D., Pelham, W. E., Gnagy, B., Fabiano, G., Waxmonsky, J., Yu, J., & Murphy, S. (2012, accepted). Experimental design and primary data analysis for informing sequential decision making processes. Forthcoming, to appear in the journal Psychological Methods. • Technical Report available at the Methodology Center, PSU
Practicum • Autism Exercises: As before, we will go through the Autism Starter File to continue practicing/working through these primary data analyses using the Autism data set.