Download
1 / 41
410 likes | 563 Views
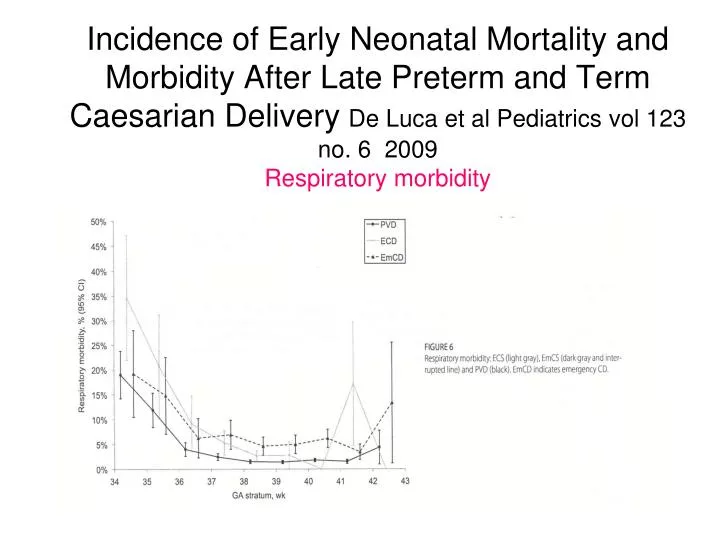
Incidence of Early Neonatal Mortality and Morbidity After Late Preterm and Term Caesarian Delivery De Luca et al Pediatrics vol 123 no. 6 2009 Respiratory morbidity.

E N D
Incidence of Early Neonatal Mortality and Morbidity After Late Preterm and Term Caesarian Delivery De Luca et al Pediatrics vol 123 no. 6 2009Respiratory morbidity
Incidence of Early Neonatal Mortality and Morbidity After Late Preterm and Term Caesarian Delivery De Luca et al Pediatrics vol 123 no. 6 2009Elective Cesarian vs Planned Vaginal Delivery
Getting evidence into obstetric practice; appropriate timing of caesarian sectionNicholl and Cattell Australian Health review 2010,34,90-92 • Aim: to reduce rate of term elective CS with no medical indication before 39 completed weeks, from 30% to 10% of all term elective CS (both private and public) over a 6 month period in 2007 • Method: multidisciplinary project formed to investigate the extent of the problem and work out the intervention which was essentially pre-emptive education of all midwifery and obstetric staff and provision of evidence folders in key clinical areas
Getting evidence into obstetric practice; appropriate timing of caesarian sectionNicholl and Cattell Australian Health review 2010,34,90-92
Getting evidence into obstetric practice; appropriate timing of caesarian sectionNicholl and Cattell Australian Health review 2010,34,90-92
Prenatal Steroid Prophylaxis for Women Delivering at Late Preterm Gestation. Pediatrics. K S Joseph et al. November 2008 Looked at patterns of prenatal steroid use, RDS, and deaths from RDS in all live-born infants(USA and Nova Scotia) 3 cohorts all live-births in the USA 1989-91,1995-97, 2002-4 Results Deaths from RDS decreased in each time period for 28-32 weeks, but not 33-36 weeks in the last time period Steroid use in all preterms increased in the first time period then static (at 50% in under 32 weeks) with corresponding reduction in RDS (steroid use in 33-36 weeks peaked at only 15% in 3rd time period) Rates of induction and LSCS increased contributing to the documented increase in preterm birth rates Steroids could reduce RDS substantially at 33-34 weeks gestation Recommend steroid prophylaxis at 33-34 weeks gestation and consider at 35-36 weeks gestation (These are of course very low rates across the board cf. UK/Australasia)
Early discharge Among Late Preterm and Term Newborns and Risk of Neonatal Morbidity Tomashek et al Semin Perinatol 30 2006 1004 late preterm/ 24320 term infants Vaginal delivery, discharge within 48 hours Readmission, observational stays recorded for first 28 days of life Late pre- terms almost twice as likely to be readmitted and 1.5 times more likely to require subsequent hospital related care Breast feeding late pre-terms more likely to have ↑ morbidity than non breast fed
Long Term Preterm Outcomes McCormick. `Two possibilities require further elucidation. The first is that preterm delivery is as a result of, not a precursor to conditions resulting in significant disability. ………The second possibility, especially for less severe disability is the post-discharge environment of the preterm infant.
Long term Outcome of the Late Preterm 2Petrini J. Increased risk of Adverse Neurological Development for Late Preterm Infants J Ped Feb 2009
Long term Outcome of the Late Preterm 3 Moster D. Long Term Medical and Social Consequences of Preterm Birth N Eng J M 2008 359; 262-273 All infants born alive1967-1983 without congenital anomalies in Norway. Late preterm infants were more likely to have Cerebral palsy 2.7 times (95% CI 2.2-3.3) Intellectual Disability 1.6 times (95% CI 1.4-1.8) Other Major disabilities (blindness, hearing loss, seizures) 1.5 times ( (95%CI 1.2-1.8) Also schizophrenia, disorders of pschological development, behaviour, and emotion more common
Proportion of children with special educational needs MacKay et al PLoS Medicine 7(6): e1000289. doi:10.1371/journal.pmed.1000289
Prevalence, Stability, and Predictors of Clinically significant Behavioural Problems in LBW Children at 3, 5, and 8 years of age Gray et al Pediatrics 2004;114;736-743 869/985 low birth weight infants studied as part of larger Infant Health and Development Program 19-21% of infants born at 34-37 weeks gestation had clinically significant behavioural problems at 8years The rates were similar to those born in 31-34 week and 25-30 week gestation cohorts This is double that expected in term infants These rates remained stable over time
School Outcomes of Late Preterm infants: Special Needs and Challenges for infants born at 32-36 Weeks Gestation 2 Lisa Chyl et al. J Pediatr. July 2008 Results for late preterm infants(34-36wks) (adjusted for sex, race, maternal education) Lower reading scores to 1st grade (p<0.05) Poor reading and maths scores risk at 1st grade (p<0.05) Teacher evaluations for reading and maths worse (both p<0.05) Special education participation higher in late preterm infants in early grades Some catch up in later grades (3rd and 5th) A gradient of outcome demonstrated with 32-33 wks doing the worst. The study results have implications for directing resources in early childhood and early school ages
Morse S Paediatrics April 2009 Early School-age Outcomes of Late Preterm Infants
Estimates of the cost and length of stay changes that can be attributed to one-week increases in gestational age for premature infantsPhibbs et al. Early Human Development(2006) 82 85-95 Estimated potential savings per one week increases in gestational age for pre-terms California cohort data -all births 1998-2000 Mean $30,145 at 33 wks (n=4,719) $10,535 at 34wks (n=14,541) $6,007 at 35 wks (n=25,077) $3,444 at 36 weeks (n=44,922)
Cardiovascular risk factors at age 30 following pre-term birth : Dalziel et al International J of Epidemiology 2007 Low gestational age at birth ( but not birth weight) associated with increased adult BP and insulin resistance At age 30 twice as many participants with diagnosed hypertension in the preterm group 80% of the preterm group born at >32 weeks gestation
Late preterm birth increases hypertension in young adulthood 23-27 weeks 28-32 weeks 33-34 weeks 35-36 weeks 37-42 weeks ≥43 weeks unadjusted adjusted hypertensive prescription OR (95% CI) All Swedish births 1973-9 n = 636,552 25-37 years old Hypertensive prescription in year of study Crump et al Am J Epidemiol 2011; 173:797-803
Treatment perceptions for level 2 and level 3Parent’s Perceptions of Illness Severity in high risk Newborns Stacey Brooks1, Keith Petrie1, Simon Rowley21 Dept of Psychological Medicine, University of Auckland2 Nation women’s Health, ACH Level 2 Level 3 Wilcoxon Signed Ranks Test. Based on positive ranks **p<.01;*p<0.5
Morbidities in the Late Preterm Compared with term infants late preterm infants have higher rates of Respiratory distress Apnoea Hypothermia Hypoglycaemia Feeding –nasogastric tubes, iv infusions Sepsis evaluations Jaundice, kernicterus Hospital re-admissions SIDS(2 times rate) Long term issues –development and behaviour - diabetes -heart disease, hypertension Mortality
Neonatal and 5 year outcomes after birth at 30-34 weeks of gestation; Marret et al: Obstet Gynecol 2007;110;72-80 Regional study, large cohort (EPIPAGE study) born 1997 (2018 /2467of 30-34 weeks GA infants followed up, 1461 to 5 years)Medical and neuropsych assessment at 5 years All adverse neonatal outcomes decreased with increasing gestational age Cerebral palsy in -6.3% at 30 weeks - 3.7% at 33 weeks -0.7% at 34 weeks 25% at 33 or 34 weeks had mild to severe cognitive impairment (> 2x general pop)
School Outcomes of Late Preterm infants: Special Needs and Challenges for infants born at 32-36 Weeks Gestation 1 Lisa Chyl et al. J Pediatr. July 2008 Data from the Early childhood Longitudinal Study-Kindergarten cohort 2 cohorts out of 970 preterm infants (32-33wks, 34-36wks compared with 13,671 term controls Test scores, teacher evaluations, and special education enrolments from kindergarten compared Testing hypothesis that infants born in USA at 32-36 weeks gestation without significant neonatal complications had higher rates of learning difficulties than term classmates
Cardiovascular risk factors at age 30 following pre-term birth : Dalziel et al International J of Epidemiology 2007 458/988 30 year olds from RCT of antenatal steroids (Liggins and Howie 1972) 147 born at term, 311 born preterm Aim to look at influence of gestational age and fetal growth (birth weight z scores) on systemic BP fasting cholesterol, TG, cortisol insulin, glucose following oral GTT
Long term Outcome of the Late Preterm 2 Petrini J. Increased risk of Adverse Neurological Development for Late Preterm Infants J Ped Feb 2009 Californian retrospective study using hospital databases Decreasing gestational age associated with increasing risk of cerebral palsy, developmental delay and mental retardation Late preterm 3 times more likely to have cerebral palsy. Modest increased risk of intellectual disability and developmental delay OR 1.25 (1.01-1.54)
Reproduction by gestational age at birth in women and men born in 1967-1976 Swamy et al, JAMA 2008;299(12):1429
Long term Outcome of the Late Preterm 1 Morse S Paediatrics April 2009 Early School-age Outcomes of Late Preterm Infants Born in Florida 1996-7 at 34-41 weeks.(n=15,2661) Exclusion of babies who stayed more than 3 days, multiples, cong abnormalities and transfers ( ie a ‘healthy’ population) Late preterms compared to terms had risk of developmental delay or disability 4.3% versus 3% -early childhood 4.5% vs 3.9% -prekindergarten at 3yrs 7.4% vs 6.6% -pre -school at 5yrs
Infants need to actively maintain a FRC. Compliance decreases with increasing gestational age
Cardiovascular risk factors at age 30 following pre-term birth : Dalziel et al International J of Epidemiology 2007 Conclusion: Adults born moderately preterm have increased BP and insulin resistance. Preterm birth rather than poor fetal growth is the major determinant of this.
Short Term Outcomes of Infants Born at 35 and 36 Weeks Gestation: We Need to Ask More Questions. Escobar et al. Semin Perinatol 30:28-33 2006 Reviewed existing published data quantifying short term hospital outcomes of 35-36 weeks gestation(death, resp distress requiring support, re-hospitalisation) At 35-36 weeks infants- 8% supplemental oxygen (3x term rate) Mortality 0.8% Re-hospitalisation rates higher ( only significant at 36 weeks)
Feeding Problems of Late Preterms Suck – ineffective Latch – difficult May benefit from nipple shield Does not open mouth wide with stimulus Abnormal tongue movements Can’t attain grasp Low suck frequency Can’t sustain negative pressure Insufficient suckling to initiate milk ejection response Doesn’t nurse long enough to provide sufficient flow to constitute a complete feed. Behavioural states less defined Tires easily Quiet or active alert Crying, deep sleep Light or active sleep,drowsy
Breast feeding rates in the late preterm Merewood, A, Brooks, D, Bauchner, H, et al. Maternal birthplace and breastfeeding initiation among term and preterm infants: a statewide assessment for Massachusetts. Pediatrics 2006; 118:e1048. Singleton breastfeeding initiation rates -63% 24-31wks -70% 32-37wks -77% term Decreasing rates with decreasing prematurity
Decreased expiratory flow in infants who were healthy late preterms Colin et al Pediatrics 2010; 126: 115-128
Cost of the late preterm The Cost of Prematurity: Quantification by Gestational Age and Birth Weight. Gilbert et al Obstet Gynecol Sept 2003 Increasing length of stay and cost.. At 34 wks LOS 5.9 days, cost $7200 At 35 wks LOS 3.9 days, cost $4200 At 36 wks LOS 2.8 days cost $2600 This trend continues with increasing gestation so that at 38 weeks, LOS is 1.8 days and cost is $1100 Frequency of complications Medical outcomes a hidden cost Hospital readmission rates 2-3 fold higher than full term
Background Clinician’s perceptions of illness structured around NICU education, NICU experience, peer network of other health professionals -are likely to be more objective than lay perceptions There is likely mismatch between parent and physician perception of illness severity In adults it has been shown that illness severity perception may have significant effect on adjustment and recovery from a health condition
Implications Clinicians should be aware that parents’ views of their infants’ illness are likely to be significantly more negative than their own assessments. This may lead to miscommunications. This is more likely with the less sick level 2 infants Currently more clinician time is spent talking with parents of the sicker level 3 infants This study suggests that clinicians consider increasing communication with parents of the less sick infants
Perinatal Outcomes Associated with Preterm Birth at 33 to 36 Weeks’ Gestation: A Population-Based Cohort Study :Khasu et al Pediatrics 2009; 123 British Columbia Perinatal Database Registry accessed All singleton births from 33-40 weeks gestation 1999-2002 Mortality and morbidity data compared between 33-36 wks(n=6,381) and term(n=88,867) groups Stilbirth, perinatal, neonatal, and infant mortality rates significantly higher in the late preterm group Late preterms had significantly higher incidence of respiratory morbidity and infection
Risk factors for the Development of RDS and TTN in Newborn Infants –Dani et al. Eur Resp J;199; 14; 155-159
Illness perceptions of level 2 and level 3 mothersParent’s Perceptions of Illness Severity in high risk Newborns Stacey Brooks1, Keith Petrie1, Simon Rowley21 Dept of Psychological Medicine, University of Auckland2 Nation women’s Health, ACH Mann Whitney U test **p<.01; * p<.05
Parent’s Perceptions of Illness Severity in high risk Newborns Stacey Brooks1, Keith Petrie1, Simon Rowley2 1 Dept of Psychological Medicine, University of Auckland 2 Nation women’s Health, ACH
Re-admission of the late Preterm Rates 2-3 times higher than term infants 3-5 times more likely to be be admitted in 1st 15 days after discharge from maternity Causes include jaundice, feeding difficulties, poor weight gain, dehydration, and apnoea For late readmissions bronchiolitis and gastroenteritis are most common
Kernicterus in Late Preterm Infants Cared for as Term Healthy Infants. Bhutani, Semin Perinatol 2006; 30:89-97
Perinatal Outcomes Associated with Preterm Birth at 33 to 36 Weeks’ Gestation: A Population-Based Cohort Study :Khasu et al Pediatrics 2009; 123