Download
1 / 20
200 likes | 287 Views
SPATIAL ANALYSIS OF SHRIMP TRAWLER SURVEYS & SEA TURTLE STRANDINGS ON THE GEORGIA COAST. LARA HALL ∙ CAPSTONE PROPOSAL ∙ DECEMBER 2013. Presentation Outline. Project Background & Literature Review Research Objectives Data sets Shrimp Trawler Locations Sea Turtle Strandings

E N D
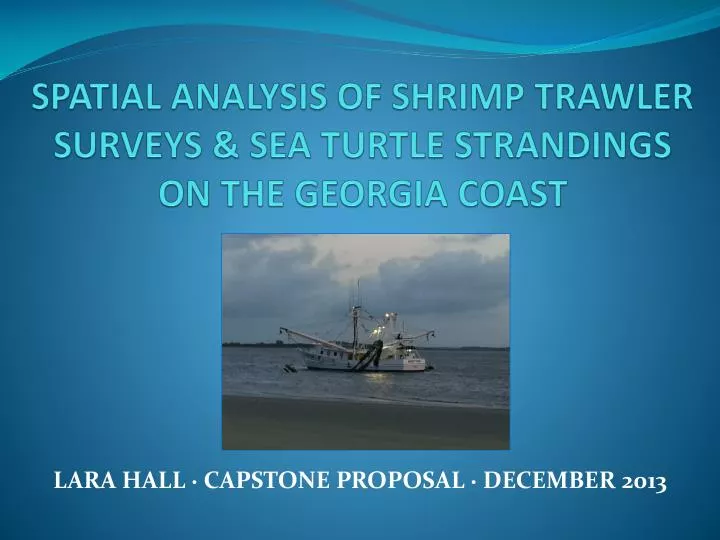
SPATIAL ANALYSIS OF SHRIMP TRAWLERSURVEYS & SEA TURTLE STRANDINGSON THE GEORGIA COAST LARA HALL ∙ CAPSTONE PROPOSAL ∙ DECEMBER 2013
Presentation Outline • Project Background & Literature Review • Research Objectives • Data sets • Shrimp Trawler Locations • Sea Turtle Strandings • Boat Boardings and TED Violations • Methodology • Data Preparation • Density Analysis • Temporal Analysis • Distance Analysis • Expected Outcomes
Literature Review TED – A Turtle Excluder Device is a grid of metal bars that attaches to a trawl net, creating an opening that allows sea turtles and larger fish to escape. Small animals such as shrimp go between the bars and are caught in the end of the trawl.
Literature Review Trawling activities by the fishing industry continue to be one of the most common non-natural causes of death for sea turtles, accounting for more than 80% of deaths between 1990 and 2007 (Finkbeiner et al. 2011).
Literature Review • Use fleet communication systems to respond to real-time bycatch hotspots • Use of predictive modeling to identify areas for closure • Identify combinations of environmental factors to predict sea turtle hotspots • Setting maximum adult bycatch limits • Reducing the size of the fishing fleet • Using strandings to understand the spatial and temporal patterns of the mortality events
Research Objectives • What spatial patterns are present in the location of shrimp trawlers and sea turtle strandings on the Georgia coast from 1999 to 2013? • Do these patterns change as a function of covariates, such as boat size or cause of death? • How have the patterns changed over time? Do they vary with season? • Are sea turtle strandings correlated with shrimping intensity or to TED violations?
Presentation Outline Data sets • Shrimp Trawler Locations • Sea Turtle Strandings • Boat Boardings and TED Violations
Data: Shrimp Trawler Surveys • Recorded from 1999 to 2012 • A total of 7,906 locations for analysis • Grouped by seasons: early, mid and late • Also categorized by boat size: small, large, and extra-large • Most records fall into the early season and large boat categories
Data: TED Violations • 309 records • 72 violations • 42 significant violations
Presentation Outline Methodology • Data Preparation • Density Analysis • Temporal Analysis • Distance Analysis
Methodology: Data Preparation • Create feature classes • Remove records • Create additional fields • Create feature classes from subsets of data • Create study area
Methodology: Data Preparation • Determine appropriate cell size • Create raster layers from feature classes
Methodology: Density Analysis Kernel Density Estimation or KDE analysis provides a way to distribute individual counts over the study area to better understand the distribution.
Methodology: Distance Analysis • Feature-based proximity toolset • Near Tool • Point Distance • Euclidean distance analysis • Distance • Direction • Allocation
Expected Outcomes • Shrimp trawler locations will be clustered and will vary according to season and boat size. • Sea turtle strandings will not be clustered, with the exception of the subset for no apparent injuries. • Both trawler locations and strandings will vary with time. • Strandings from no apparent injuries will correlate with TED violations but not with high shrimp boat density. • Improved understanding of best management practices for the Georgia Sea Turtle Conservation Program
QUESTIONS? Thank you to all of the agencies supporting this research.