Download
1 / 28
280 likes | 390 Views
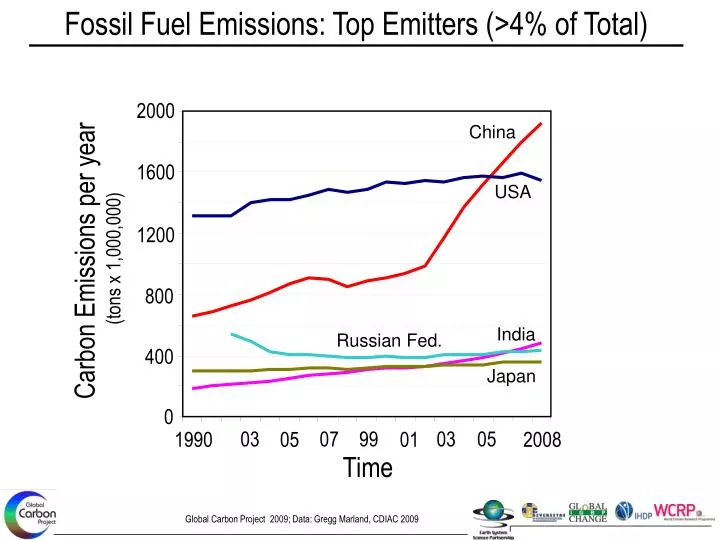
Fossil Fuel Emissions: Top Emitters (>4% of Total). 2000. China. 1600. USA. 1200. Carbon Emissions per year (tons x 1,000,000). 800. India. Russian Fed. 400. Japan. 0. 03. 07. 99. 03. 05. 1990. 05. 01. 2008. Time.

E N D
Fossil Fuel Emissions: Top Emitters (>4% of Total) 2000 China 1600 USA 1200 Carbon Emissions per year (tons x 1,000,000) 800 India Russian Fed. 400 Japan 0 03 07 99 03 05 1990 05 01 2008 Time Global Carbon Project 2009; Data: Gregg Marland, CDIAC 2009
Fossil Fuel Emissions: Profile Examples (1-4% of Total) UK 160 Canada South Africa 120 Carbon Emissions per year (tons x 1,000,000) Brazil 80 Australia Spain 40 Denmark 0 03 07 99 03 05 1990 05 01 2008 Time Global Carbon Project 2009; Data: Gregg Marland, CDIAC 2009
MtC Warm colors Net exporters of embodied carbon Cold colors Net importers of embodied carbon BEET Balance of Emissions Embodied in Trade (BEET) Year 2004 Peters and Hertwich 2008, Environ, Sci & Tech., updated
5 5 55% Annex B Developed Nations Annex B Developed Nations 4 4 45% 3 3 25% of growth Developing Nations Non-Annex B 2 2 Developing Nations Non-Annex B 2000 2010 2000 2010 1990 1990 Transport of Embodied Emissions CO2 emissions (PgC y-1) Global Carbon Project 2009; Le Quéré et al. 2009, Nature Geoscience; Data: Peters & Hetwich 2009; Peters et al. 2008; Weber et al 2008; Guan et al. 2008; CDIAC 2009
4 40% Oil 3 36% Coal CO2 emissions (PgC y-1) 2 Gas 1 Cement 0 2000 2010 1990 CO2 Emissions Components Le Quéré et al. 2009, Nature Geoscience
1.3 1.2 1.1 Per Capita Emissions (tC person-1 y-1) 1990 1995 2000 2005 2010 Per Capita CO2 Emissions Developed countries continue to lead with the highest emission per capita Le Quéré et al. 2009, Nature Geoscience; CDIAC 2009
Averages Full range of IPCC individual scenarios Fossil Fuel Emissions: Actual vs. IPCC Scenarios Raupach et al. 2007, PNAS, updated; Le Quéré et al. 2009, Nature Geoscience; International Monetary Fund 2009
10 8 Fossil fuel 6 CO2 emissions (PgC y-1) 4 Land use change 2 1970 1980 2010 2000 1960 1990 CO2 Emissions from Land Use Change Le Quéré et al. 2009, Nature Geoscience; Data: CDIAC, FAO, Woods Hole Research Center 2009
Colombia Cameroon Venezuela Nicaragua Peru Rep.Dem.Congo India Nigeria Philippines Nepal 4-2% <1% 2-1% Net CO2 Emissions from Land-Use Change (LUC) in Tropical Countries 2000-2005 600 60% 500 Brazil 400 Indonesia CO2 emissions (TgC y-1) 300 200 100 0 RA Houghton 2009, unpublished; Based on FAO Global Forest Resource Assessment
(Area) Emissions from Land Use Change (2000-2005) Canadell et al. 2009, Biogeosciences
10 8.7 8 Fossil fuel 6 CO2 emissions (PgC y-1) 4 Land use change 1.2 2 1970 1980 2010 2000 1960 1990 Total Anthropogenic Emissions 2008 9.9 PgC 12% of total anthropogenic emissions Le Quéré et al. 2009, Nature Geoscience; Data: CDIAC, FAO, Woods Hole Research Center 2009
1970 – 1979: 1.3 ppm y-1 1980 – 1989: 1.6 ppm y1 • 1990 – 1999: 1.5 ppm y-1 2000 - 2008: 1.9 ppm y-1 Atmospheric CO2 Concentration Year 2008 385 ppm 38% above pre-industrial Annual Mean Growth Rate 2008 1.79 2007 2.12 2006 1.77 2005 2.41 2004 1.62 2003 2.22 2002 2.40 2001 1.85 2000 1.24 Data Source: Pieter Tans and Thomas Conway, NOAA/ESRL
Key Diagnostic of the Carbon Cycle Evolution of the fraction of total emissions that remain in the atmosphere 10 Total CO2 emissions 8 CO2 Partitioning (PgC y-1) 6 Atmosphere 4 2 1970 1980 2010 2000 1960 1990 Data: NOAA, CDIAC; Le Quéré et al. 2009, Nature Geoscience
Trend: 0.27±0.2 % y-1 (p=0.9) 45% 40% Airborne Fraction Fraction of total CO2 emissions that remains in the atmosphere 1.0 0.8 0.6 Airborne Fraction 0.4 0.2 1970 1980 2010 2000 1960 1990 Le Quéré et al. 2009, Nature Geoscience; Canadell et al. 2007, PNAS; Raupach et al. 2008, Biogeosciences
Modelled Natural CO2 Sinks Le Quéré et al. 2009, Nature Geoscience
Estimated Trends in Sea-Air pCO2 1981-2007 μatm y-1 outgas uptake Le Quéré et al. 2009, Nature Geoscience
Emissions are rising faster than the time scales regulating the rate of uptake by sinks. Sinks are becoming less efficient at high CO2 Land: saturation of the CO2 fertilization effect Ocean: decrease in [carbonate] which buffers CO2 Land and/or ocean sinks are responding to climate change and variability. We are missing sink processes in models that are contributing to the observed changes. Possible Reasons for a Positive Trend in Airborne Fraction
Human Perturbation of the Global Carbon Budget 2000-2008 PgC deforestation Source tropics extra-tropics 1.4 CO2 flux (Pg C y-1) Sink Time (y) Global Carbon Project 2009; Le Quéré et al. 2009, Nature Geoscience
Human Perturbation of the Global Carbon Budget 2000-2008 PgC fossil fuel emissions 7.7 Source deforestation 1.4 CO2 flux (Pg C y-1) Sink Time (y) Global Carbon Project 2009; Le Quéré et al. 2009, Nature Geoscience
Human Perturbation of the Global Carbon Budget 2000-2008 PgC fossil fuel emissions 7.7 Source deforestation 1.4 CO2 flux (Pg C y-1) atmospheric CO2 4.1 Sink Time (y) Global Carbon Project 2009; Le Quéré et al. 2009, Nature Geoscience
Human Perturbation of the Global Carbon Budget 2000-2008 PgC fossil fuel emissions 7.7 Source deforestation 1.4 CO2 flux (Pg C y-1) atmospheric CO2 4.1 Sink ocean 2.3 (4 models) Time (y) Global Carbon Project 2009; Le Quéré et al. 2009, Nature Geoscience
Human Perturbation of the Global Carbon Budget 2000-2008 PgC fossil fuel emissions 7.7 Source deforestation 1.4 CO2 flux (PgC y-1) atmospheric CO2 4.1 Sink land 3.0 (5 models) ocean 2.3 (4 models) Time (y) Global Carbon Project 2009; Le Quéré et al. 2009, Nature Geoscience
Human Perturbation of the Global Carbon Budget 2000-2008 PgC fossil fuel emissions 7.7 Source deforestation 1.4 CO2 flux (PgC y-1) atmospheric CO2 4.1 Sink land 3.0 (5 models) ocean 2.3 (4 models) 0.3 Residual Time (y) Global Carbon Project 2009; Le Quéré et al. 2009, Nature Geoscience
1.4 PgC y-1 4.1 PgC y-1 45% 3.0 PgC y-1 29% + 7.7 PgC y-1 26% 2.3 PgC y-1 Fate of Anthropogenic CO2 Emissions (2000-2008) Le Quéré et al. 2009, Nature Geoscience; Canadell et al. 2007, PNAS, updated
The efficiency of the natural sinks has being declining over the last 60 years, a trend not fully captured by climate models. The human perturbation of the carbon cycle continues to grow strongly and track the most carbon intensive scenarios of the IPCC. The economic crisis will likely have a transitional impact on the growth of CO2 emissions and a undetectable effect on the growth of atmospheric CO2 (because the much larger inter-annual variability of the natural sinks). Conclusions
Canadell JG, Raupach MR, Houghton RA (2009) Anthropogenic CO2 emissions in Africa. Biogeosciences 6: 463-468. International Monetary Fund (2009) World economic outlook. October 2009. http://www.imf.org/external/pubs/ft/weo/2009/02/index.htm Le Quéré C, Raupach MR, Canadell JG, Marland G et al. (2009) Trends in the sources and sinks of carbon dioxide. Nature geosciences, doi: 10.1038/ngeo689. Marland G, Hamal K, Jonas M (2009) How uncertain are estimates of CO2 emissions. Journal of Industrial Ecology 13: 4-7. Peters GP, Hertwich E G (2008) CO2 embodied in international trade with implications for global climate policy. Environmental Science and Technology 42, 1401-1407. Raupach MR, Canadell JG, Le Quéré C (2008) Drivers of interannual to interdecadal variability in atmospheric in atmospheric CO2 growth rate and airborne fraction. Biogeosciences 5: 1601–1613. Sitch S, Huntigford C, Gedney N et al. (2008) Evaluation of the terrestrial carbon cycle, future plant geography and climate-carbon cycle feedbacks using five Dynamic Global Vegetation Models (DGVMs). Global Change Biology 14: 1–25, doi: 10.1111/j.1365-2486.2008.01626.x. van der Werf GR, Randerson JT, Giglio L, Collatz GL, Kasibhatla PS, Arellano AF, Jr (2006) Interannual variability in global biomass burning emissions from 1997 to 2004. Atmos. Chem. Phys. 6: 3423–3441. References cited in this ppt