Download
1 / 20
200 likes | 309 Views
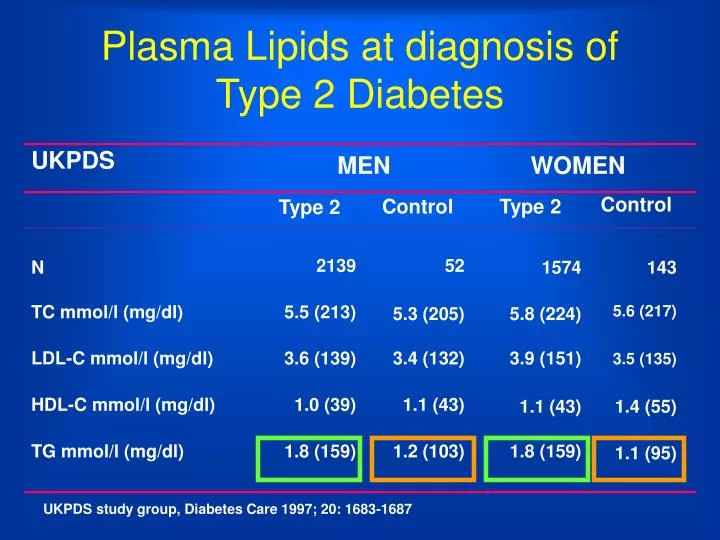
UKPDS. MEN. WOMEN. Type 2. Control. Type 2. Control. N. 2139. 52. 1574. 143. TC mmol/l (mg/dl). 5.5 (213). 5.3 (205). 5.8 (224). 5.6 (217). LDL-C mmol/l (mg/dl). 3.6 (139). 3.4 (132). 3.9 (151). 3.5 (135). HDL-C mmol/l (mg/dl). 1.0 (39). 1.1 (43). 1.1 (43). 1.4 (55).

E N D
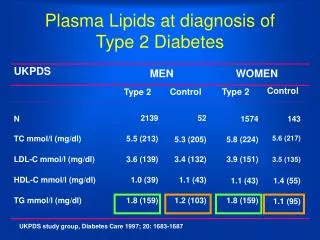
UKPDS MEN WOMEN Type 2 Control Type 2 Control N 2139 52 1574 143 TC mmol/l (mg/dl) 5.5 (213) 5.3 (205) 5.8 (224) 5.6 (217) LDL-C mmol/l (mg/dl) 3.6 (139) 3.4 (132) 3.9 (151) 3.5 (135) HDL-C mmol/l (mg/dl) 1.0 (39) 1.1 (43) 1.1 (43) 1.4 (55) TG mmol/l (mg/dl) 1.8 (159) 1.2 (103) 1.8 (159) 1.1 (95) Plasma Lipids at diagnosis of Type 2 Diabetes UKPDS study group, Diabetes Care 1997; 20: 1683-1687
160 140 Diabetes No diabetes 120 100 CV mortality per10.000 person years 80 60 40 20 0 mmol/L < 4.7 4.7-5.1 5.2-5.7 5.8-6.2 6.3-6.7 6.8-7.2 ³ 7.3 total cholesterol MRFIT: DM type 2 and cardiovascular mortality Stamler J et al. Diabetes Care 16(2): 434 - 444, 1993
No Diabetes Diabetes LDL particles LDL particles ‘Normal’ LDL-cholesterol ‘Normal’ LDL-cholesterolhowever: LDL-apo B LDL-apo B/CE LDL-CE/TG Diabetes and DyslipidemiaLDL- size and diabetes High Low CHD risk M. Austin JAMA 1988; 269: 1916
LDL diameter (nm) 28 R= -0.88 27 26 25 24 23 0 1 2 3 4 5 6 Plasma TG (mmol/L) LDL diameter vs plasma TG Scheffer et al; Clin Chem 1997;43:1904-12
Clinical Trials of Lipid Therapy in Diabetic Subjects (subgroup analysis) Studyjournal N LDL-C Baseline CHDlowering LDL-C reductionPrimary preventionHelsinki HS Diabetes 135 -6 % 4,9 mmol/l -60 % (ns) Care 1992 191 mg/dlAFCAPS/TEXCAPS JAMA 1998 264 -25% 3.9 mmol/l -43 % (ns) 150 mg/dl Secondary preventionCARE NEJM 1996 586 -28 % 3,5 mmol/l -25 % (p=0.05)137 mg/dl4S Diabetes 202 -36 % 4,8 mmol/l -55 % (p=0.002)Care 1997 186 mg/dl Haffner Diabetes Care; 1: 1998
Number of prevened Fatal and non fatal MI’s Expected fatal and non fatal Ml’s patients with diabetes patients without diabetes Risk Reduction4 S trial Estimated CHD reduction after treating 100 CHD patients for 6 years 49 24 29 9 Pyörälä K et al. Diabetes Care 20(4): 614 - 620, 1997
Management Of Lipids in Patients with Diabetes Mellitus Type 2
Risk Factor Management General Rules • Risk factor assessment • Setting goals for therapy • Primary prevention • Secondary prevention • Specific modalities of therapy based on impact and practicality • Lipid management • Asperin use • Blood pressure control • Smoking cessation • Glycemic control • Weight management
Suggested Risk FactorTarget Levels RISK FACTOR GOAL Blood pressure 130/80 mm Hg HbA1c <7.5% BMI <25kg/m2 Waist circumference males <98 cm females <88 cm Urinary albumin excretion <30 mg/day
Lipid Management Glycaemic Control • Glucose lowering in untreated diabetics will improve the lipidprofile • Better glycaemic control, independent of mode of therapy, further improves the lipidprofile • Unfortunately target lipid levels are not achieved with good glycaemic control in most patients
Lipid Targets for Patients with Type 2 Diabetes Mellitus Target (mg/dl)Plasma Lipid Acceptable IdealTriglycerides 200 150 Total cholesterol 200 170 LDL-cholesterol 130 100 Non-HDL-cholesterol 160 130 HDL-cholesterol 35 45 • Haffner SM. Management of dyslipidemia in adults withdiabetes [American Diabetes Association position state-ment].Diabetes Care. 1998;21:160-178. • Garg A. Treatment of diabetic dyslipidemia. Am JCardiol. 1998;81(4A):47B-51B.
B-mode US B-mode US B-mode US Patient population • FH • LDL-C >212 mg/dL • TG <400 mg/dL Atorvastatin 80 mg Simvastatin 40 mg 2 years ASAP Study Design 326patients • Primary efficacy parameter: • Change in carotid and femoral IMT Patients are initiated on atorvastatin 40 mg or simvastatin 20 mg. Doses are doubled at Week 4
Atorvastatin mmol/l mg/dl TC 9.99 386 TG 1.86 165 HDL-C 1.17 45 LDL-C 8.00 309 Simvastatin mmol/l mg/dl 10.27 396 1.85 164 1.16 45 8.33 322 Baseline Lipid Profile
Atorvastatin (80 mg) TC - 42% 5.73 mmol/l 221 mg/dl TG - 29% 1.23 mmol/l 109 mg/dl HDL +13% 1.32 mmol/l mg/dl LDL - 51% 3.88 mmol/l 150 mg/dl Simvastatin (40 mg) - 34% 6.71 mmol/l 259 mg/dl -17 % 1.41 mmo/l 125 mg/dl + 13 % 1.30 mmol/l 50 mg/dl - 41 % 4.81 mmol/l 186 mg/dl Cholesterol lowering (n=325)
Atorvastatin Progression female 35.1 % male 31.8 % Regression female 64.9 % male 68.2 % Simvastatin Progression female 57.4 % male 58.1 % Regression female 42.5 % male 41.9 % % patients with progression
Priorities for Treatment Strategiesof Diabetic Dyslipidemia • LDL-cholesterol lowering • Triglyceride lowering • HDL-cholesterol raising • Other approaches • Non-HDL cholesterol • Apo B • Remnants
Future Directions Ongoing Trials with Lipid Lowering Focus HPS Simvastatin CARDS Atorvastatin ASPEN Atorvastatin LDS Cerivastatin / Fenofibrate DAIS Fenofibrate FIELD Fenofibrate