Download
1 / 10
100 likes | 155 Views
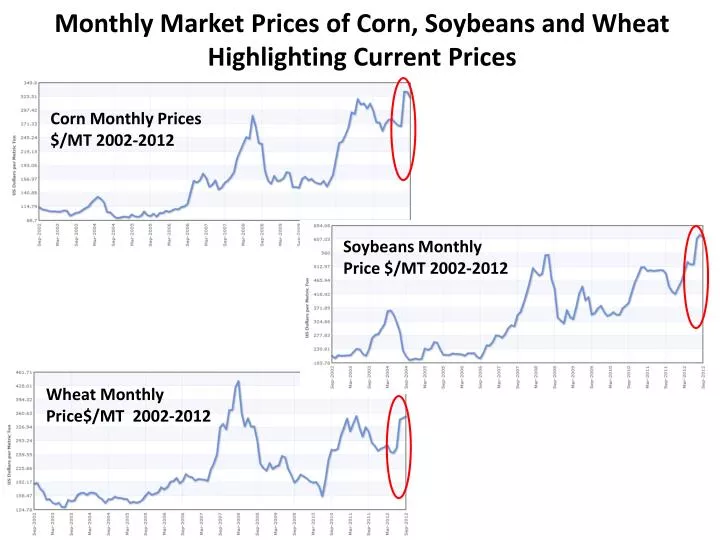
Monthly Market Prices of Corn, Soybeans and Wheat Highlighting Current P rices. Corn Monthly Prices $/ MT 2002-2012. Wheat Monthly Price$/MT 2002-2012. Soybeans Monthly Price $/ MT 2002-2012. Crop Statistics from International Agencies. Colors indicate different agencies

E N D
Monthly Market Prices of Corn, Soybeans and Wheat Highlighting Current Prices Corn Monthly Prices $/MT 2002-2012 Wheat Monthly Price$/MT 2002-2012 Soybeans Monthly Price $/MT 2002-2012
Crop Statistics from International Agencies Colors indicate different agencies Squares indicate reported end of season estimates Circles indicate in-season forecasts First time estimates from international agencies are directly compared in forecasting mode Goal is to identify agreements and disagreements to help develop best practices for different cropping systems improved, more reliable forecasting systems
Need for Improved Agricultural Intelligence International recognition of critical need for improved information including at the World Summit on Food Security 2009, G20 Action Plan on Food Price Volatility and Agriculture, 2011 official statement of The Extraordinary Joint Intersessional meeting of the Intergovernmental Group (IGG/FAO) on Grains, Rome 2010: “Unexpected price hikes and volatility are amongst major threats to food security and their root causes need to be addressed, in particular regarding the lack of reliable and up-to-date information on crop supply and demand and export availability….”
The G20 Initiative: GEO-GLAM • The G20 Cannes Summit (November 2011) Action Plan on Food Price Volatility and Agriculture • Reaffirmed GEOGLAM commitment at the 2012 G-20 Los Cabos Declaration & in Agriculture Ministers Report
WHERE? Cropmask Sources: USGS NLCD (USA), CORINE (Europe), Africover (Africa), South Africa, Zimbabwe (national products), MODIS UMD MCD12q1 (rest of world). compiled by UMD
AT WHAT LEVEL OF DETAIL(SPATIAL RESOLUTION)? Data Source: IIASA, Ecosystems Services & Management, based on interpolation of 50,000 GEOWIKI collected validation points
WHEN? Data source: UMD crop calendar (USA), SAGE crop calendar (rest of world)
WHEN? Data source: UMD crop calendar (USA), SAGE crop calendar (rest of world)
HOW OFTEN? Data source: UMD, based on MODIS Terra data from 2000-2011