Download
1 / 7
70 likes | 221 Views
Scope and Totals. Sent approximately 200 email invitationsSurvey was conducted on TRCA website116 respondents 1094 systemsStorage total: 15,500,000 gallonsReports from 20 installers in 13 countiesReports from 96 individuals in 29 counties. The Grass-Roots Effect. Comments can be interprete

E N D
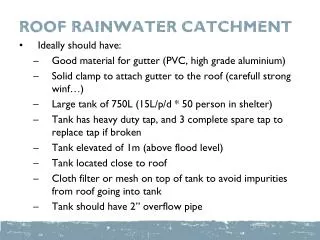
1. TRCA Rainwater Survey Thanks to all who participated
Two forms � summary data from installers, detail on individual systems
We did not attempt to make it a full inventory of systems in the state. Numerous demo systems, for instance, are not included unless reported by an installer.
Consider it a sampling, not statistically accurate. No standard deviations or probabilities. Probably tainted by enthusiasm of the respondees.
Thanks to all who participated
Two forms � summary data from installers, detail on individual systems
We did not attempt to make it a full inventory of systems in the state. Numerous demo systems, for instance, are not included unless reported by an installer.
Consider it a sampling, not statistically accurate. No standard deviations or probabilities. Probably tainted by enthusiasm of the respondees.
2. Scope and Totals Sent approximately 200 email invitations
Survey was conducted on TRCA website
116 respondents
1094 systems
Storage total: 15,500,000 gallons
Reports from 20 installers in 13 counties
Reports from 96 individuals in 29 counties
Selected Texas members of ARCSA and entire membership of TRCA who had provided email addresses.
Selected Texas members of ARCSA and entire membership of TRCA who had provided email addresses.
3. The Grass-Roots Effect Comments can be interpreted as showing:
Individuals report multiple systems (replacements and additions) and desire to expand.
Customer satisfaction and enthusiasm is high.
Many individuals are building their own larger systems with help from designers, subcontracting part of the work.
Promotion and workshops are effective in creating rainwater catchment growth.
This much can be gathered from free-form comments made largely by individual respondents.
Might have gone viral through the Master Gardener community as well, some through the email list, and some because of Vicki Blachman of Travis County. She has a blog that details construction (DIY) of her home system. Emailed her, explained the survey. She filled out a survey, and kindly forwarded email invitations to a number of master gardeners. We had responses from Master Gardeners in at least 8 counties.
We gathered all responses, but only included systems that had over 300 gallons in the statistics that follow. Many of their comments were valuable, however, as these represented the largest subset of urban rainwater enthusiasts. The show a lot of creativity in putting together low-cost systems using linked rain barrels. All seem to want larger systems, so we will be hearing more from them.This much can be gathered from free-form comments made largely by individual respondents.
Might have gone viral through the Master Gardener community as well, some through the email list, and some because of Vicki Blachman of Travis County. She has a blog that details construction (DIY) of her home system. Emailed her, explained the survey. She filled out a survey, and kindly forwarded email invitations to a number of master gardeners. We had responses from Master Gardeners in at least 8 counties.
We gathered all responses, but only included systems that had over 300 gallons in the statistics that follow. Many of their comments were valuable, however, as these represented the largest subset of urban rainwater enthusiasts. The show a lot of creativity in putting together low-cost systems using linked rain barrels. All seem to want larger systems, so we will be hearing more from them.
4. Profile of individuals� systems Average gallons: 10,679
Non-potable: 56%, avg. gallons 3,529
Potable only: 15%, avg. gallons 13,045
Combo: 29%, avg. gallons 23,148
Potable + Combo: 44%, avg. gallons 19,780
Rainwater the only supply: 16%
DIY, (includes w/subs): 63%
Of DIY, used design help 20%
Over half are non-potable, fairly small systems.
Responses with > 300 gal.
We asked about the type of property
Non-potable only, > 300 gal � equally rural and suburban, one urban: all have backup supply
Potable � larger systems, 15% of the number of systems. All but 1 are rural
Combo systems � the largest average size
Everyone with no backup supply had a combination system. All were rural properties
5. Profile of installers� systems Average gallons: 14,470
Non-potable: 37%
Potable/Combo: 63%
Rainwater the only supply: 34%
Systems are generally larger, some are commercial, education, government installations.
Non-potable vs. potable ratio almost the reverse of individual systems (more potable systems)
Greater percent have no onsite backup supply
Average storage size is about about 40% greater than individuals reported. More non-residential systems being reported in this group (commercial, government, irrigation uses).
You can see here that the potable/non-potable ratio is almost the reverse of the individuals� systems, and the percentage with no onsite backup supply is about double that of the individuals� systems.
Most installers report that they do business in more counties than their home counties and surrounding counties. 20% also work out-of-state.Average storage size is about about 40% greater than individuals reported. More non-residential systems being reported in this group (commercial, government, irrigation uses).
You can see here that the potable/non-potable ratio is almost the reverse of the individuals� systems, and the percentage with no onsite backup supply is about double that of the individuals� systems.
Most installers report that they do business in more counties than their home counties and surrounding counties. 20% also work out-of-state.
6. Comments from participants Need better filtration, reduced maintenance
Individuals cite information shortage
Installers: Costs/ROI are a hurdle
Roadblocks � inspectors, codes, utilities
Individuals: 75% scored satisfaction a 5 (of 5)
Installers: improve the good-old-boy image
Installers: need clear, unbiased standards, local incentives and state promotion
7. Individuals� Installations by Year Don�t have this same information for installers, they were summary reports.
Are we seeing the effects of state encouragement and a good how-to book?Don�t have this same information for installers, they were summary reports.
Are we seeing the effects of state encouragement and a good how-to book?