Download
1 / 40
400 likes | 573 Views
Item Response Theory in Health Measurement. Outline. Contrast IRT with classical test theory Introduce basic concepts in IRT Illustrate IRT methods with ADL and IADL scales Discuss empirical comparisons of IRT and CTT Advantages and disadvantages of IRT

E N D
Outline • Contrast IRT with classical test theory • Introduce basic concepts in IRT • Illustrate IRT methods with ADL and IADL scales • Discuss empirical comparisons of IRT and CTT • Advantages and disadvantages of IRT • When would it be appropriate to use IRT?
Test Theory • Any item in any health measure has two parameters: • The level of ability required to answer the question correctly. • In health this translates into the level of health at which the person doesn’t report this problem • The level of discrimination of the item: how accurately it distinguishes well from sick
Classical Test Theory • This is the most common paradigm for scale development and validation in health. • Few theoretical assumptions, so broadly applicable • Partitions observed score into True Score + Error • Probability of a given item response is a function of person to whom item is administered and nature of item • Item difficulty: proportion of examinees who answer item correctly (in health context: item severity…) • Item discrimination: biserial correlation between item and total test score.
Classical test theory • Probability of ‘no’ answer depends on type of item (difficulty) and the level of physical functioning (e.g. SF-36 bathing vs. able to do vigorous activities) • Some limitations • Item difficulty, discrimination, and ability are confounded • Sample dependent; item difficulty estimates will be different in different samples. Estimate of ability is item dependent • Difficult to compare scores across two different tests because not on same scale • Often, ordinal scale of measurement for test • Assumes equal errors of measurement at all levels of ability
Item Response Theory • Complete theory of measurement and item selection • Theoretically, item characteristics are not sample dependent; estimates of ability are not item dependent • Item scores are presented on the same scale as ability • Puts all individual scores on standardized, interval level scale; easy to compare between tests and individuals
Item Response Theory • Assumes that a normally distributed latent trait underlies performance on a measure • Assumes unidimensionality • I.e., all items measure the same construct • Assumes local independence • Items are uncorrelated with each other when ability is held constant • Given unidimensionality, any response to an item is a monotonically increasing function of the latent trait (see the item characteristic curves in next slide)
Illustration of IRT with ADL and IADL Scales • The latent traits represent the ability to perform self-care activities and instrumental activities (necessary for independent living) • Item difficulty (b): the level of function corresponding to a 50% chance of endorsing the item • Item discrimination (a): slope of the item characteristic curve, or how well it differentiates low from high functioning people
Example of differing item characteristic curves(Note: parameter = 2.82 for the steep curve, 0.98 for the shallow curve)
IRT can show distribution of respondents along theta and can alsoshow distribution of item difficulties (lower chart)
And can also show you the theta location of different response levels (here 0 to 3 scale)
Differential Item Functioning Assuming that the measured ability is unidimensional and that the items measure the same ability, the item curve should be unique except for random variations, irrespective of the group for whom the item curve is plotted… …items that do not yield the same item response function for two or more groups are violating one of the fundamental assumptions of item response theory, namely that the item and the test in which it is contained are measuring the same unidimensional trait…
Item Bias • Items may be biased against one gender, linguistic, or social group • Can result in people being falsely identified with problems or missing problems • Two elements in bias detection • Statistical detection of Differential Item Functioning • Item review • If source of problems not related to performance, then item is biased
DIF detection • Important part of test validation • Helps to ensure measurement equivalence • Scores on individual items are compared for two groups: • Reference • Focal group under study • Groups matched on total test score (ability)
DIF detection • DIF can be uniform or nonuniform • Uniform • Probability of correctly answering item correctly is consistently higher for one group • Nonuniform • Probability of correctly answering item is higher for one group at some points on the scale; perhaps lower at other points
3 models • One-parameter (Rasch) model provides estimates of item difficulty only • Two-parameter model provides estimates of difficulty and discrimination • Three-parameter model allows for guessing • IRT does have different methods for dichotomous and polytomous item scales
IRT models: dichotomous items • One parameter model • Probability correct response (given theta)= 1/[1 + exp(theta – item difficulty)] • Two-parameter model • Probability correct response (given theta) = 1/{1 + exp [ – discrimination (theta – item difficulty)]} Three parameter model: Adds pseudo-guessing parameter Two parameter model is most appropriate for epidemiological research
Steps in applying IRT • Step One: Assess dimensionality • Factor analytic techniques • Exploratory factor analysis • Study ratio of first to second eigenvalues (should be 3:1 or 4:1) • Also χ2 tests for dimensionality • Calibrate items • Calculate item difficulty and discrimination and examine how well model fits • χ2 goodness of fit test • Compare goodness of fit between one-parameter and two-parameter models • Examine root mean square residual (values should be < 2.5)
Steps in IRT: continued • Score the examinees • Get item information estimates • Based on discrimination adjusted for ‘standard error’ • Study test information • If choosing items from a larger pool, can discard items with low information, and retain items that give more information where it is needed
Item Information • Item information is a function of item difficulty and discrimination. It is high when item difficulty is close to the average level of function in the group and when ICC slope is steep
The ADL scale example • Caregiver ratings of ADL and IADL performance for 1686 people • 1048 with dementia and 484 without dementia • 1364 had complete ratings
ADL/IADL example • Procedures • Assessed dimensionality. Found two dimensions: ADL and IADL • Assessed fit of one-parameter and two parameter model for each scale • Two-parameter better • Only 3 items fit one-parameter model • Sig. improvement in χ2 goodness of fit • Used two-parameter model to get item statistics for 7 ADL items and 7 IADL items
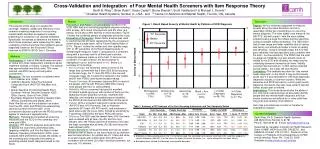
ADL/IADL • Got results for each item: difficulty, discrimination, fit to model • Results for item information and total scale information
Example of IRT with Relative’s Stress Scale • The latent trait (theta) represents the intensity of stress due to recent life events • Item severity or difficulty (b): the level of stress corresponding to a 50% chance of endorsing the item • Item discrimination (a): slope of the item characteristic curve, or how well it differentiates low from high stress cases • Item information is a function of both: high when (b) is close to group stress level and (a) is steep
Stress Scale: Item Information • item information is a function of item difficulty and discrimination. It is high when item difficulty is close to group stress level and when ICC slope is steep
Stress Scale: Item Difficulty • Item severity or difficulty (b) indicates the level of stress (on theta scale) corresponding to a 50% chance of endorsing the item
Stress Scale: Item Discrimination • item discrimination reflected in the slope of the item characteristic curve (ICC): how well does the item differentiate low from high stress cases?
Example of developing Index of Instrumental Support • Community Sample: CSHA-1 • Needed baseline indicator of social support as it is important predictor of health • Concept: Availability and quality of instrumental support • Blended IRT and classical methods
Sample • 8089 people • Randomly divided into two samples: • Development and validation • Procedures • Item selection and coding • 7 items
Procedure • IRT analyses • Tested dimensionality • Two-parameter model • Estimated item parameters • Estimated item and test information • Scored individual levels of support
External validation • Internal consistency • Construct validity • Correlation with size of social network • Correlation with marital status • Correlation with gender • Predictive validity
Empirical comparison of IRT and CTT in scale validation • Few studies. So far, proponents of IRT assume it is better. However, • IRT and CTT often select the same items • High correlations between CTT and IRT difficulty and discrimination • Very high (0.93) correlations between CTT and IRT estimates of total score
Empirical comparisons (cont’d) • Little difference in criterion or predictive validity of IRT scores • IRT scores are only slightly better • When item discriminations are highly varied, IRT is better • IRT item parameters can be sample dependent • Need to establish validity on different samples, as in CTT
Advantages of IRT • Contribution of each item to precision of total test score can be assessed • Estimates precision of measurement at each level of ability and for each examinee • With large item pool, item and test information excellent for test-building to suit different purposes • Graphical illustrations are helpful • Can tailor test to needs: For example, can develop a criterion-referenced test that has most precision around the cut-off score
Advantages of IRT • Interval level scoring • More analytic techniques can be used with the scale • Ability on different tests can be easily compared • Good for tests where a core of items is administered, but different groups get different subsets (e.g., cross-cultural testing, computer adapted testing)
Disadvantages of IRT • Strict assumptions • Large sample size (minimum 200; 1000 for complex models) • More difficult to use than CTT: computer programs not readily available • Models are complex and difficult to understand
When should you use IRT? • In test-building with • Large item pool • Large number of subjects • Cross-cultural testing • To develop short versions of tests • (But also use CTT, and your knowledge of the test) • In test validation to supplement information from classical analyses
Software for IRT analyses • Rasch or one parameter models: • BICAL (Wright) • RASCH (Rossi) • RUMM 2010 http://www.arach.net.au/~rummlab/ • Two or three parameter models • NOHARM (McDonald) • LOGIST • TESTFACT • LISREL • MULTILOG