Download
1 / 12
120 likes | 198 Views
Food Injustice in Inglewood and The South bay. Prepared by: Danielle DeRuiter -Williams Winter 2011. Los Angeles County. Population: 11,099,059 Over half of CA Population is Obese 25% of youth are obese 2 million diagnosed with diabetes. Inglewood and the South Bay.

E N D
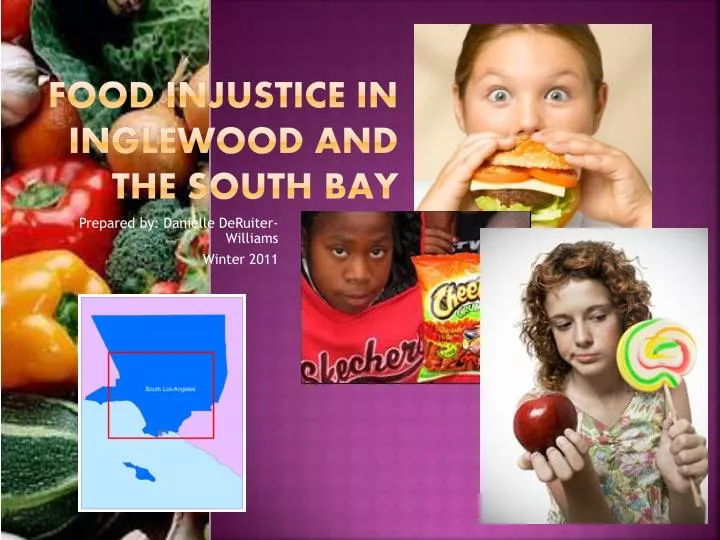
Food Injustice in Inglewood and The South bay Prepared by: Danielle DeRuiter-Williams Winter 2011
Los Angeles County • Population: 11,099,059 • Over half of CA Population is • Obese • 25% of youth are obese • 2 million diagnosed with • diabetes
Food Justice • Access to: • healthy • affordable • organic • locally grown • culturally relevant food
“Access” • Location matters • The further from healthy food options a population is the more likely they are to experience diet related diseases such as diabetes, hypertension, obesity, heart disease, etc.
Quality and Affordability • Selected three grocery stores • Whole Foods—Relatively unaffordable/Good Quality • Trader Joe’s—Relatively Affordable/Good Quality • Food 4 Less—Poor Quality/Affordable • Why not Ralph’s, Albertsons, etc? • Selected stores show a spectrum of food options • In general, Ralph’s and similar offer limited organic options at high prices.
Not Just Race but also Class Trader Joe’s has a policy of NOT locating stores in areas with a median income of less than 45k
Next Steps • Essentially find ways to create access • Exploration of CRA policies on vacant land—potential community gardens • Inventory of privately owned vacant land • Analysis of public transportation hubs/need to find ideal location for farmer’s market • Map zip codes of newly acquired trees
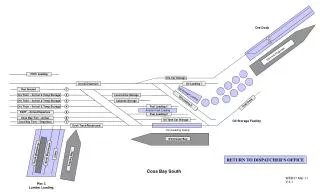
Skills Employed • Inset Map (Slide 2) • Attribute Sub-Set Selections (Slide 6—Querying fast food and liquor stores in Inglewood-only to create new layer) • Boundary Sub-Set Selections (Slides 3,4,5,6—Inglewood City Boundaries) • Buffering (Slides 6,7,8—1 mile buffer around each grocery store) • Geocoding (Slides 3,4,5,6—Addresses of groceries, fast food and liquor stores) • Geoprocessing (Slides 2-6 clipping of CaliDetail and Block Groups)