Download
1 / 40
400 likes | 521 Views
Survey of visitors, employees and residents in South Bank Autumn 2008 – Spring 2009 Presented by Sally Panayiotou Wednesday 13 th May 2009. Methodology: Visitors and employees. Employees 30 th October-20 th November 2008

E N D
Survey of visitors, employees and residents in South Bank Autumn 2008 – Spring 2009Presented by Sally Panayiotou Wednesday 13th May 2009
Methodology: Visitors and employees • Employees • 30th October-20th November 2008 • 205 face-to-face interviews with people who work in the South Bank area • Random (one in n) selection of respondents at 9 sample points • Visitors • 9th September-29th October 2008 • 322 face-to-face interviews with visitors to the South Bank • Random (one in n) selection of respondents at 6 sample points
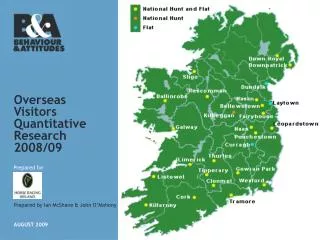
Methodology: Visitors and employees • Residents 1999 • 1st February -18th April 1999 • 825 face-to-face interviews with people who live in Bishop’s and Cathedral’s Ward up to Lambeth Road • Respondents selected to quotas according to age, gender and work status from PAF in South Bank • Residents 2008-9 • 5th November 2008 - 25th February 2009 • 472 face-to-face interviews with people who live in Bishop’s and Cathedral’s Ward marked in red • Random selection of respondents from PAF in South Bank Note that different methodologies and slightly different sample areas means comparisons are only indicative 3
Profile Visitors Employees Residents Data weighted to Census profile / ONS updates • Younger (nearly half <35) • White (93%) • Female (61%) • 25-54 (77%) • White (83%) • Male (62%) • 16-34 (49%) • More diversity, but majority white • (31% BME) • Even gender split (51/49) NB 16-34 32% Great Britain 40% London Base: All visitors (322), All employees (205), All residents (472) 2008-9
How long have residents lived in South Bank? How long have you lived… In this area? At your current address? 1-3 yrs 4-15 yrs 16 yrs + Base: All residents (472), 2008/9
Residents’ place of work From this card, can you tell me whereabouts do you work? % 90% work in London Base: All in employment (304), 2008/9
Many visitors have visited South Bank before 19% first visit (mainly overseas visitors) 31% more than 20 previous visits Base: All visitors (322) Autumn 2008
Residents have a high level of satisfaction of living in the area How satisfied or dissatisfied are you with this area as a place to live? 1999 Survey Very dissatisfied: 2% Fairly dissatisfied: 2% Neither/nor: 3% Very satisfied Fairly satisfied Base: All residents (472), 2008/9, All residents (825), 1999
Longer-term residents less likely to have seen improvements over the past five years Would you say this area as a place to live has got better, worse or remained the same during the last five years? 1999 Survey Net better +16 Better (47% exc. dk) Don’t know Net better +25 Worse (15% exc. dk) About the same (38% exc. dk) Base: All residents (472), 2008/9, All residents (825) 1999
Employees have a high level of satisfaction of working in the area Half are very satisfied! (Top end of scale) Further 37% fairly satisfied 5% = 87% satisfied Base: All employees (205) Autumn 2008
Longer-term employees in particular have seen improvements in the last five years Would you say this area as a place to work has got better, worse or remained the same during the last five years? Total excluding don’t knows (160) Don’t know Worse Same Better Better Worse (Excluding don’t knows %) About the same Base: All employees (205), Autumn 2008 Base sizes shown in brackets * note low base
Visitors show high levels of advocacy for the South Bank How likely would you be to recommend South Bank to your friends and relatives? (Not very/not at all likely: <1%) Fairly likely Certain to Very likely Base: All visitors (322), Autumn 2008
High levels of satisfaction with services provided locally Overall, how satisfied or dissatisfied are you with services provided locally? Very dissatisfied: 2% Fairly dissatisfied Neither/nor Very satisfied NB As a place to live: 42% very satisfied 50% fairly satisfied Fairly satisfied Base: All residents (472), 2008/9
Over a third of residents expressing an opinion feel local services have improved in the past 5 years Taking everything into account, would you say local services have got better, worse or remained the same during the last five years? Don’t know Better (39% exc. dk) Worse (7% exc. dk) About the same (54% exc. dk) Base: All residents (472), 2008/9 (excluding don’t knows 361) Base sizes shown in brackets
High levels of satisfaction with restaurants and bars & pubs How satisfied or dissatisfied are you with the following leisure and recreation facilities and services in the local area? Residents Restaurants Employees Residents Bars and pubs Employees Parks and open spaces Residents Employees Residents Shops Employees NB in 1999 57% of respondents wanted to see improvements made to shops = Highest demand for improvement Base: All residents (472) and employees (205), 2008/9
Low satisfaction with swimming facilities How satisfied or dissatisfied are you with the following leisure and recreation facilities and services in the local area? Community meeting spaces Residents (239) Employees (114) Residents (326) Outdoors sports facilities Employees (130) Residents (225) Play facilities Employees (103) Residents (323) Swimming facilities Employees (122) Base sizes shown in brackets (all excluding don’t knows)
Lower resident satisfaction with education provision for young people (schools and services) How satisfied or dissatisfied are you with the following education facilities and services in the local area? Base sizes shown in brackets = all excluding don’t know
Satisfaction with the health facilities - users Net satisfaction 2008/9 survey MORI norms +100 +86 +70 +86 +50 +66 +44 +50 How satisfied or dissatisfied are you with the following health facilities and services in the local area? Base sizes shown in brackets: All residents who have used each service, 2008/9 **note extremely low base
Residents / employees: High levels of satisfaction with public transport, street lighting and personal safety How satisfied or dissatisfied are you with the following aspects of the local environment? Net satisfaction Public transport +93 Residents +76 Employees Street lighting Residents +71 +75 Employees Personal safety Residents +60 Employees +59 Base: All residents (472) and employees (205), 2008/9
Residents / employees: Greater dissatisfaction with rough sleepers and provision of public toilets How satisfied or dissatisfied are you with the following aspects of the local environment? Numbers of rough sleepers Net satisfaction Residents +23 -23 Employees On-street parking control Residents -2 Employees +11 Provision of public toilets Residents -38 Employees -36 Base: All residents (472) and employees (205), 2008/9
Fairly low experience of crime in the area In the past 12 months, have you been a victim of any of these crimes in this area? Residents Employees 90% None of these 83% None of these Base: All residents (472) and employees (205), 2008/9
Visitor satisfaction with shopping options lower; based both on perceptions and experience How satisfied or dissatisfied are you with the following in South Bank? Very / fairly dissatisfied Very / fairly satisfied Eating and drinking options Neither Did visit cafes / restaurants / bars in one of listed areas (90*) Didn’t visit one of listed areas (206) Shopping Did visit shops in one of listed areas (75*) Didn’t visit shops in one of listed areas (159) Base sizes shown in brackets, excludes don’t knows * note low base
Lower Marsh / The Cut and Southbank Centre most popular amongst employees / residents for food / drink From the following list of cafes, bars and restaurants, which, if any, have you visited in the last year? % Residents % Employees 29% none of these 31% none of these Base: All employees (205) and residents (472) 2008/2009
Lower Marsh / The Cut and Southbank Centre also popular amongst employees / residents for shops In the last year have you visited the shops in any of these locations? Residents Employees 10% none of these 19% none of these Base: All employees (205) and residents (472) 2008/2009
Southbank centre most popular amongst visitors for refreshments and shops At which of these locations, if any, have you visited / or do you intend to visit today? Cafes, bars and restaurants Shops 70% none of these 76% none of these Base: All visitors (322)
Employees most likely to have visited Southbank Centre in the past year; residents the London Eye From the following list of local attractions, which, if any have you visited in the last year? Employees Residents Base: All employees (205) and residents (472) 2008/2009
Attractions are the greatest pull for visitors; or simply enjoying the area What were your 3 main reasons for deciding to visit South Bank today? Base: All visitors (322), Autumn 2008
The London Eye is the biggest draw for visitors 18% the Southbank Centre 13% the London Aquarium 7% the National Theatre 7% Gabriel’s Wharf 31% visited/intend to visit The London Eye Base: All visitors (322), Autumn 2008
Employees: more likely to select positive words than negative Which five, if any, of the words on this card would you use to describe South Bank? Base: All employees (205), Autumn 2008
Visitors: Similar descriptions to employees, but less sensitive to expense Which five, if any, of the words on this card would you use to describe South Bank? Employees 25% 25% Base: All visitors (322), Autumn 2008
Conclusions • Positive levels of satisfaction and advocacy amongst visitors, employees and residents in the South Bank • A young visitor and resident profile • London Eye is a big draw to visitors • Southbank Centre draws visitors, residents and employees • The Cut / Marsh more a zone for employees and residents rather than visitors; high levels of satisfaction with restaurants, bars and pubs across the South Bank area • Issues with public toilet provision, parking and rough sleepers; however fairly low crime levels and most feel personally safe • Residents also tend to be favourable towards health facilities • Priorities for improvement would be swimming facilities • Improvements to play facilities, and services for young people would also be appreciated
Thank you for your timeIf you have any queries regarding this research please contact:sally.panayiotou@ipsos.comor matt.cavill@ipsos.com